Why an ETF Costs More Than Its Expense Ratio
Quick answer
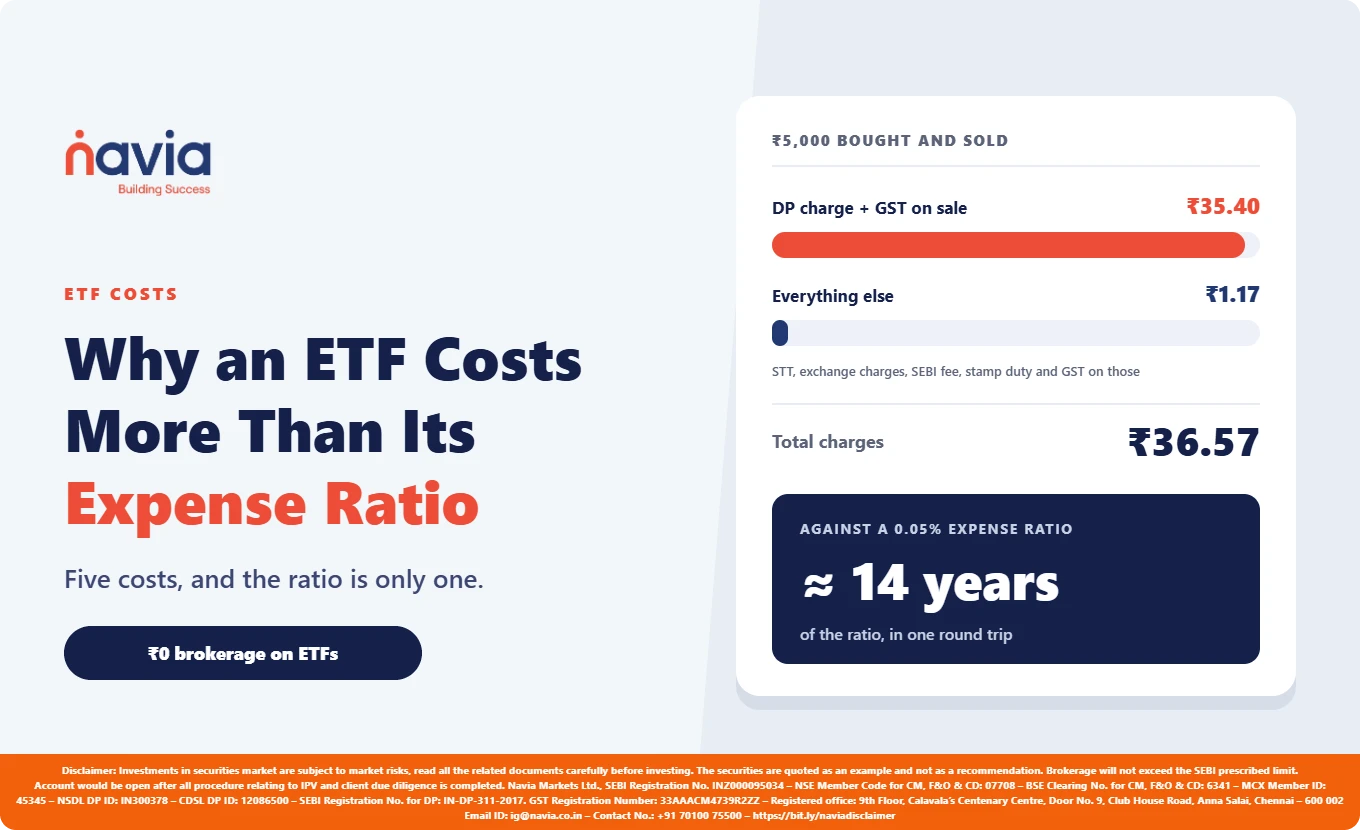
The ETF expense ratio is one of five costs, and for a small holding it is rarely the biggest. It is deducted from the fund’s NAV every day, so you never see a bill for it. The costs you do pay visibly — exchange levies, stamp duty, GST and the DP charge on every sale — arrive as rupees, and one of them has a floor. At Navia, buying and later selling ₹5,000 of an equity ETF costs about ₹36.57 in charges. Against an illustrative expense ratio of 0.05% a year, that single round trip costs roughly fourteen years of the ratio. The ratio is not what decides your total cost. The trade size is.
Key takeaways
- An ETF expense ratio is charged daily against NAV, not billed to you — which is why it gets all the attention and the rest of the cost stack gets none.
- The DP charge on selling has a minimum of ₹30 plus GST. Below a ₹1,00,000 sale that floor binds, so smaller holdings pay proportionally more.
- ETFs pay far less STT than shares. Buying units of an equity-oriented fund is exempt; selling attracts 0.001%. Shares pay 0.1% on both legs.
- Tracking difference is a real cost that appears on no statement. SEBI caps tracking error for equity ETFs at 2% and requires tracking difference to be published monthly.
- Fewer, larger trades beat frequent small ones. On total cost, how you deal matters more than the second decimal of the ratio.
What does an ETF expense ratio actually cover?
An ETF expense ratio — the total expense ratio, or TER — is the annual cost of running the fund as a percentage of net assets. It covers fund management, trustee and custodian fees, and scheme administration.
The mechanism matters more than the number. The TER is accrued daily and deducted from the fund’s NAV, so you are never invoiced and it never appears on a contract note. The return you see is already net of it.
That invisibility is the problem: because the ratio is the one cost quoted in every factsheet, it becomes the number people optimise, while the costs that arrive as actual rupees go unexamined. Our post on expense ratios and long-term ETF performance covers how the ratio compounds over a holding period; this one is about everything it leaves out.
What does it cost to buy and sell an ETF?
ETFs settle in your demat account like any other delivery trade, so the cash-segment charge sheet applies. At Navia, brokerage on ETFs is ₹0. What remains is statutory and depository cost.
| Charge | Rate | Side |
|---|---|---|
| Brokerage | ₹0 | — |
| STT | Nil on buy; 0.001% on sell | Sell only |
| Exchange transaction charges | 0.0030699% | Both |
| SEBI turnover fee | 0.0001% (₹10 per crore) | Both |
| Stamp duty | 0.015% | Buy only |
| DP charge | 0.03%, minimum ₹30, maximum ₹300, plus GST | Sell only |
| GST | 18% on brokerage, exchange, SEBI and DP charges | Both |
Take ₹5,000 of an ETF, bought and later sold at the same price:
- DP charge plus GST on the sale: ₹35.40
- Everything else — STT, exchange charges, SEBI fee, stamp duty and GST on those: ₹1.17
- Total: ₹36.57
One line item is 97% of the bill. It is not the expense ratio, and it is not brokerage.
Why the DP charge decides your real cost
The DP charge is levied when securities leave your demat account — on every sale. Navia’s rate is 0.03% of transaction value, with a minimum of ₹30 and a maximum of ₹300, plus GST.
Work out where the floor stops binding. At 0.03%, a ₹30 charge corresponds to a sale of exactly ₹1,00,000. Below ₹1,00,000 you pay the ₹30 minimum instead of the percentage. Above ₹10,00,000 the ₹300 cap takes over. Between those points you pay the stated rate.
That one fact reshapes the total cost of owning an ETF:
| Bought and sold | Total charges | As % of value | Equivalent years of a 0.05% expense ratio |
|---|---|---|---|
| ₹5,000 | ₹36.57 | 0.73% | 14.6 |
| ₹10,000 | ₹37.75 | 0.38% | 7.6 |
| ₹25,000 | ₹41.27 | 0.17% | 3.3 |
| ₹50,000 | ₹47.14 | 0.09% | 1.9 |
| ₹1,00,000 | ₹58.88 | 0.06% | 1.2 |
| ₹5,00,000 | ₹294.40 | 0.06% | 1.2 |
| ₹10,00,000 | ₹588.81 | 0.06% | 1.2 |
Illustrative. Assumes a sale at the purchase price and an expense ratio of 0.05% a year; charges computed from the rates published on Navia’s pricing page.
The percentage cost falls more than tenfold across that range while the expense ratio stays identical. Someone investing ₹5,000 a month and selling in small lots faces a completely different cost structure from someone dealing in lakhs — and no factsheet says so.

The floor applies to each ETF you sell, so splitting a holding across three similar ETFs means three floors instead of one. The full charge sheet across every segment is in Navia’s brokerage charges.
ETFs pay much less STT than shares
This is the part most comparisons get wrong, and it favours the ETF.
Securities transaction tax treats units of an equity-oriented fund differently from equity shares. Per the NSE schedule of levies, a delivery-based purchase of equity-oriented fund units is exempt, and the sale attracts 0.001%, paid by the seller. Equity shares attract 0.1% on the purchase and 0.1% on the sale.
On a ₹1,00,000 round trip that is ₹1.00 of STT on the ETF against ₹200 on the shares:
- ₹1,00,000 traded as an equity ETF: ₹58.88 in charges
- The same ₹1,00,000 traded as equity shares: ₹257.88 in charges
The entire ₹199 gap is STT. Everything else is identical.

One caution: this applies to equity-oriented ETFs. Gold, silver, debt and international ETFs are not equity-oriented funds, and their levy and tax treatment differs. Check the scheme documents rather than assuming the equity position carries across.
Tracking difference: the cost that never appears on a bill
An ETF’s job is to deliver the index return, and it never quite does. The gap is the real cost of the wrapper, wider than the expense ratio because it also absorbs the fund’s own dealing costs, cash drag and dividend reinvestment timing.
SEBI’s circular on the development of passive funds sets the framework. For ETFs and index funds other than debt funds, tracking error must not exceed 2% — the annualised standard deviation of the difference in daily returns between the index and the scheme’s NAV, over one year of rolling data. AMCs and AMFI must separately publish tracking difference monthly, over one, three, five and ten years and since units were allotted. For debt ETFs, one-year average annualised tracking difference must not exceed 1.25%.
So tracking difference is published for every ETF over periods long enough to mean something. For a fund you intend to hold for years, a persistent tracking difference of, say, 0.20% against an expense ratio of 0.05% tells you far more than the ratio does. It is the better comparison, and almost nobody makes it.
The spread you pay on the way in
The last cost goes to the market, not to any fee schedule. You buy at the ask and sell at the bid, and the difference is itemised nowhere.
For a heavily traded index ETF the spread is trivial. For a thin sectoral or thematic ETF it can exceed a year of the expense ratio in one round trip. Two defences, both free: compare the market price to iNAV before dealing — SEBI requires equity ETFs to disclose indicative NAV on the exchange within a 15-second lag — and use limit orders, avoiding the first and last minutes of the session, when spreads are widest.
What is the total cost of owning an ETF?
Five layers, and they do not scale together:
- 1Expense ratio — scales with value and time; deducted from NAV.
- 2Tracking difference — scales with time; published monthly, never billed.
- 3Statutory charges — scale with value; small for ETFs because STT is 0.001% on sale only.
- 4The DP charge — does not scale below ₹1,00,000; a ₹30 floor plus GST on every sale.
- 5Bid-ask spread — scales with how often you deal and how thin the ETF is.

The levers that move your total cost are trade size and frequency, not the second decimal of the ratio: deal in fewer, larger lots, prefer liquid ETFs, and compare published tracking difference rather than the ratio alone. You can model any of it with the Navia brokerage calculator.
Conclusion
The expense ratio is real and worth minimising, but it is the easiest cost to see and, for most retail holdings, not the largest. On a ₹5,000 round trip the DP charge and its GST are ₹35.40 of a ₹36.57 bill, and that does not shrink when you pick a cheaper fund — it shrinks when you deal less often, in larger size. ETFs are genuinely cheap to hold in India, helped by an STT treatment most investors never notice. They are not cheap to trade in small amounts, and no factsheet will warn you.
Did you find this article helpful?
Your feedback helps us write better content.

Frequently Asked Questions
What is an ETF expense ratio?
The annual cost of running the fund, stated as a percentage of net assets, covering fund management, trustee and custodian fees and scheme administration. It is accrued daily and deducted from the ETF’s NAV, so it reduces your return rather than appearing as a charge you pay.
How often is the ETF expense ratio charged?
Daily. The ratio is an annual figure accrued against the fund’s daily net assets, so a small fraction of it is reflected in the NAV each day. It never appears on a contract note or ledger because it is taken inside the fund, before the published NAV.
Do ETFs pay STT like shares do?
No. Per the NSE schedule of levies, buying units of an equity-oriented fund is exempt and selling attracts 0.001%, while equity shares attract 0.1% on both legs — ₹1.00 against ₹200 on a ₹1,00,000 round trip. Gold, silver, debt and international ETFs are not equity-oriented funds and are treated differently.
Is there an exit load on ETFs?
ETFs bought and sold on the exchange have no exit load, because you deal with another market participant rather than redeeming from the fund. You pay the bid-ask spread plus exchange and depository charges instead.
Why did my ETF return less than the index it tracks?
Part of the gap is the expense ratio, deducted daily from NAV. The rest is tracking difference — the fund’s own dealing costs, uninvested cash and dividend timing. SEBI requires it to be published monthly on the AMC and AMFI websites over one, three, five and ten years, so you can check it before buying.
What is the cheapest way to hold an ETF?
Fewer and larger transactions. The DP charge on selling carries a ₹30 minimum plus GST, which binds on any sale below ₹1,00,000, so small frequent sales cost disproportionately more. Brokerage on ETFs at Navia is ₹0, so what you control is trade size, frequency and the spread you accept.