Stocks · NSE & BSE

Own great companies
at ₹0 brokerage.

Invest in 1500+ listed stocks across NSE & BSE. Zero brokerage on both delivery and intraday — keep every rupee of your returns.

Setup free account in 5 min
₹0 delivery & intraday · Free demat · No AMC
Try the web app as a guest
Portfolio value
₹4,82,640
+₹38,210
▲ 8.6% all-time
RELIANCE12 qty · avg ₹2,710
₹2,948+8.8%
TCS8 qty · avg ₹3,640
₹3,902+7.2%
HDFCBANK20 qty · avg ₹1,520
₹1,486−2.2%
INFY15 qty · avg ₹1,410
₹1,562+10.8%
₹0 brokerage charged Illustrative holdings
₹0
Equity delivery
₹0
Equity intraday
1500+
NSE & BSE stocks
<10s
Withdrawals
Portfolio insight

See what you actually own —
and how it's really doing.

Owning sixteen stocks tells you nothing on its own. Navia turns your holdings into three answers most investors never get: where your money is really concentrated, whether a stock has genuinely beaten the market, and whether your whole portfolio has.
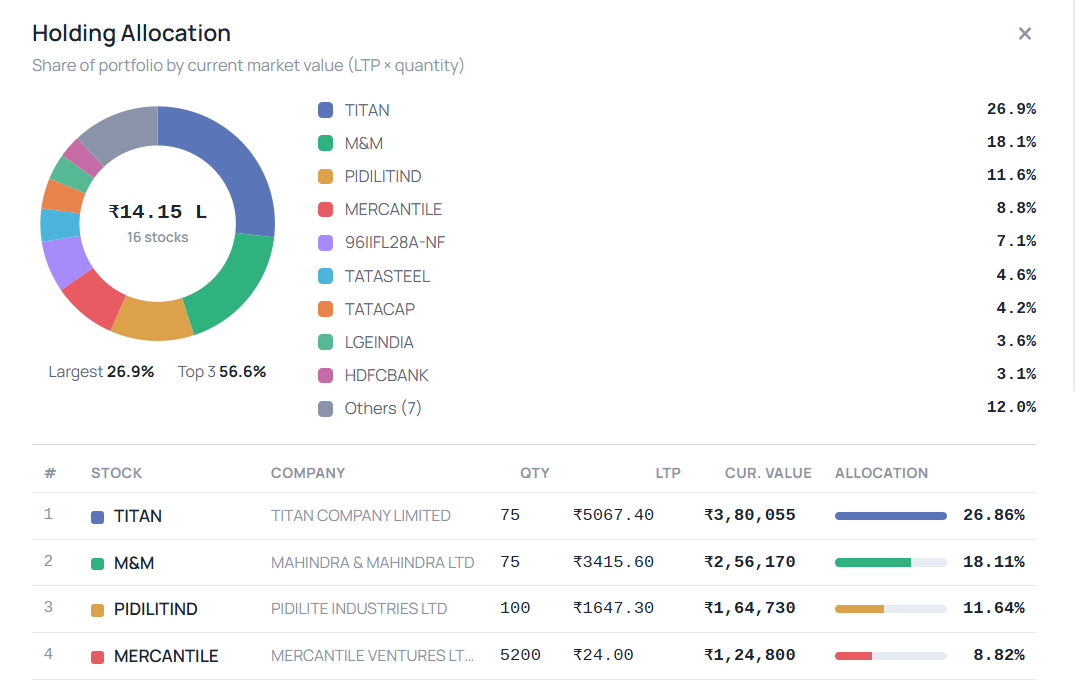
1Holding Allocation — your portfolio by market value, largest position and top-3 concentration at a glance
2Stock vs NIFTY — rebase any stock against the index over 1Y, 3Y or 5Y to see real relative performance
3Portfolio vs NIFTY — see whether your whole basket, not just one stock, has beaten the index
1Holding Allocation — where your money actually sits
Navia Holding Allocation view: a donut chart of a ₹14.15 lakh portfolio across 16 stocks, with TITAN at 26.9%, M&M at 18.1% and PIDILITIND at 11.6%, plus a per-stock table showing quantity, LTP, current value and allocation bars

A donut of every holding by current market value (LTP × quantity), with the largest position and top-3 share called out — so hidden concentration is obvious before it becomes a problem. The table below breaks out quantity, LTP, current value and each stock's allocation bar.
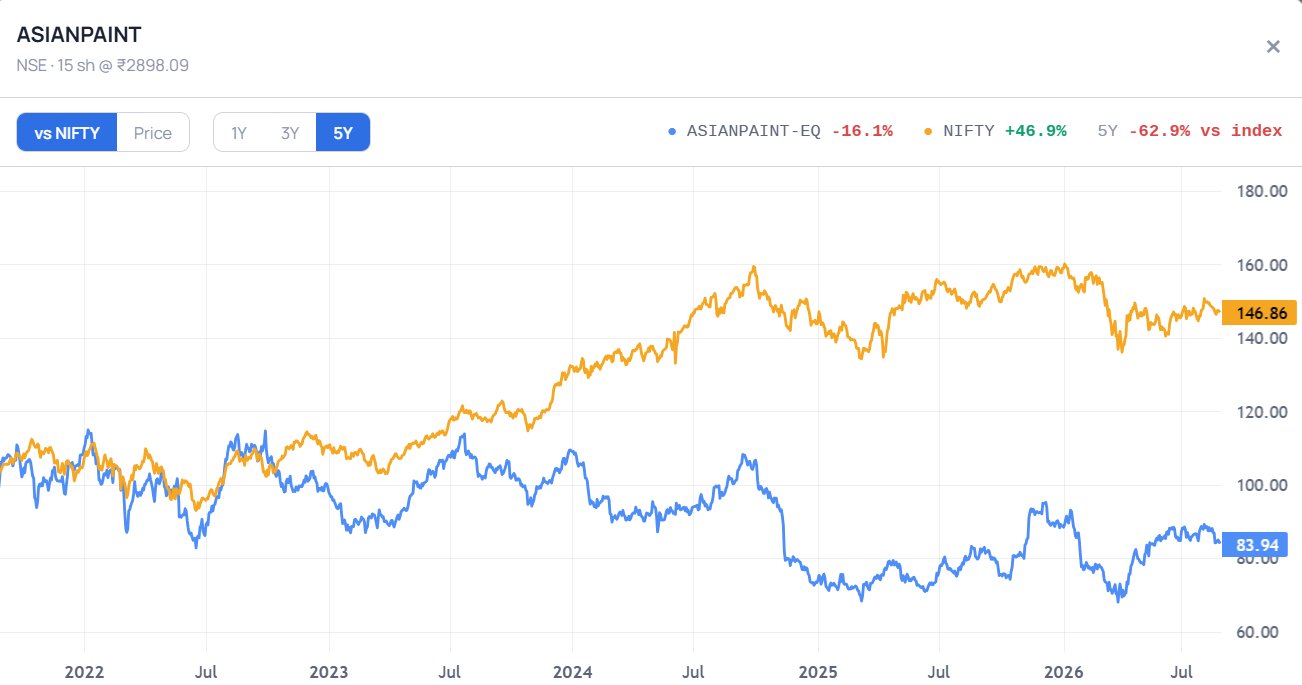
2Stock vs NIFTY — beating the index, or just riding it?
Navia vs NIFTY comparison chart: ASIANPAINT rebased against the NIFTY index over five years, showing the stock down 16.1% while NIFTY gained 46.9% — an underperformance of 62.9% versus the index

Rebase any stock against the NIFTY over 1Y, 3Y or 5Y and read the gap directly. Here ASIANPAINT is −16.1% while the index is +46.9% — a 62.9% underperformance that a price chart alone would never make plain.
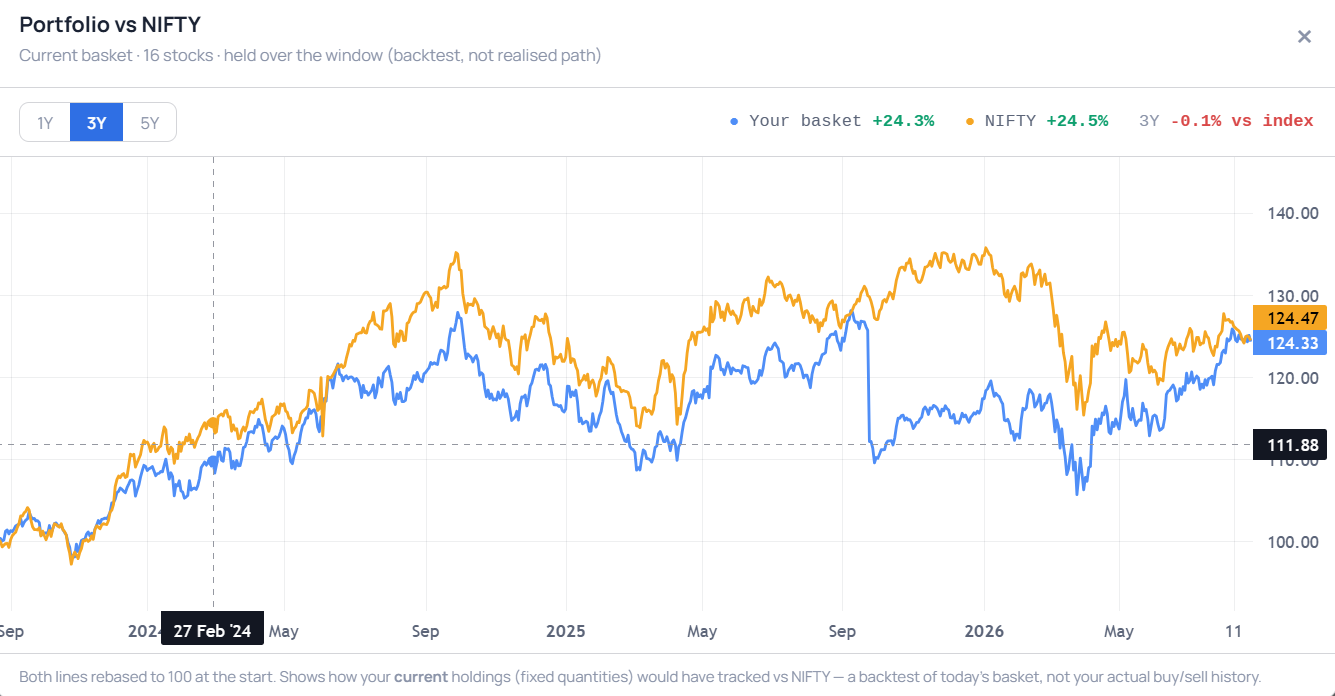
3Portfolio vs NIFTY — is the whole basket beating the index?
Navia Portfolio vs NIFTY chart: a 16-stock basket rebased against the NIFTY over three years, the basket up 24.3% against the index at 24.5% — a 0.1% shortfall versus the index

The same comparison applied to every holding at once. Your current basket is rebased to 100 alongside the NIFTY over 1Y, 3Y or 5Y — here +24.3% against the index's +24.5%, so three years of stock-picking landed 0.1% behind simply buying the index. It's a backtest of today's holdings at fixed quantities, not your actual buy and sell history.
Powerful tools

Tools that make you a better investor.

Pro charting

Multi-timeframe charts with 100+ studies and drawing tools.

Baskets

Create and invest in a basket of stocks in one click.

Holding allocation

See your portfolio by market value — largest position and top-3 concentration at a glance.

Stock vs NIFTY

Rebase any stock against the index over 1Y, 3Y or 5Y to see true relative performance.

Portfolio vs NIFTY

Backtest your whole basket against the index over 1Y, 3Y or 5Y.

Holdings pledge

Pledge holdings for margin directly from the app.

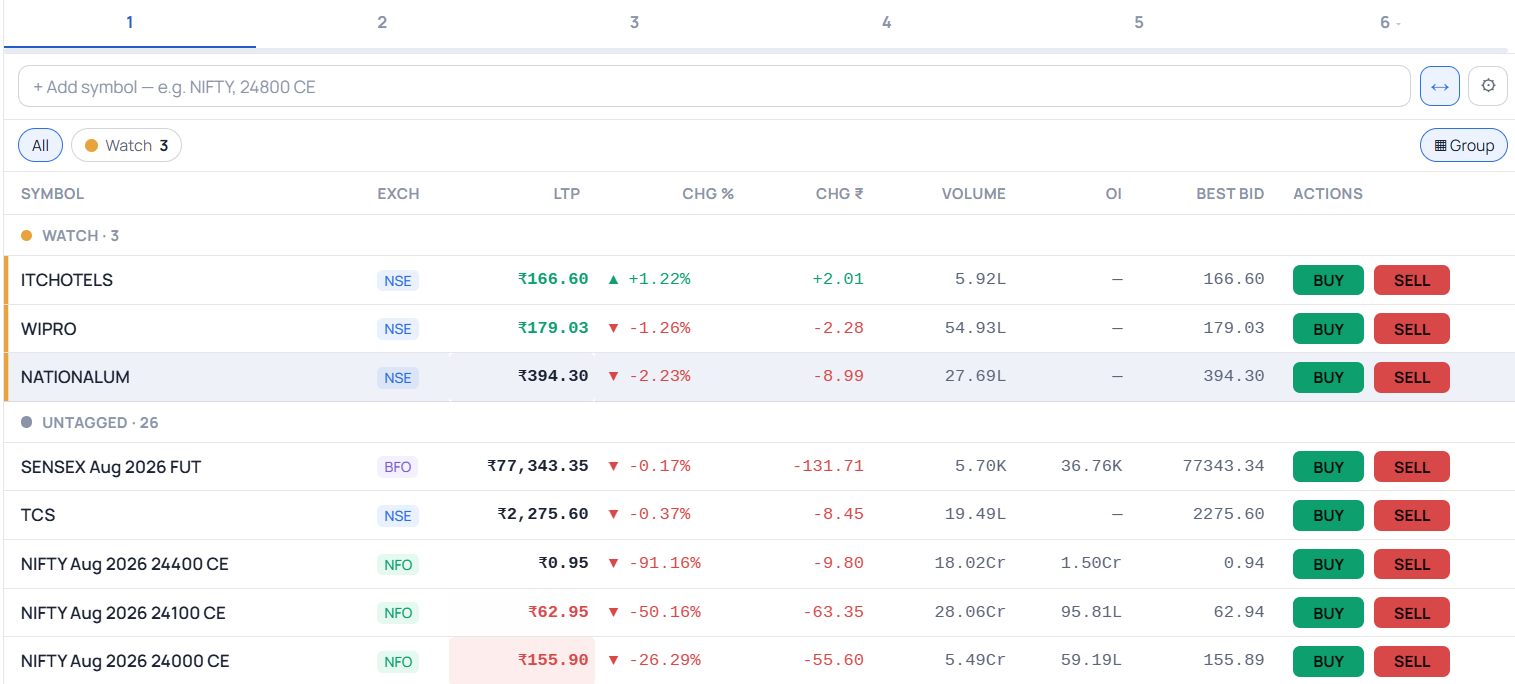
Expand the market watch for a desktop-terminal experience — in the browser

One tap on the expand control turns the watchlist into a full-width table: LTP, change % and ₹, volume, open interest and best bid side by side, with BUY / SELL on every row. Six watchlists across the top, tag-based grouping, and inline symbol search — the density of an installed terminal, with nothing to install.

Navia expanded market watch on the web platform: a full-width table across six watchlists showing symbol, exchange, LTP, change percent and rupees, volume, open interest and best bid for NSE stocks and NFO option contracts, with BUY and SELL buttons on every row
Why Navia for stocks

Everything an equity investor needs.

Zero delivery brokerage

Buy and hold for years without paying a rupee in brokerage.

Instant withdrawals

Get funds in your bank in under 10 seconds.

Advanced charts

100+ indicators, drawing tools and trade-from-chart.

Real-time alerts

Track 1000+ stocks and get notified the moment they move.

Long-term investing

Build wealth, keep your gains.

With zero delivery brokerage and zero AMC, more of your money stays invested and compounding — not lost to fees.

  • ₹0 brokerage on equity delivery
  • No annual maintenance charges
  • Free demat account for life
  • One app for stocks, MF, IPO & more
Open free account See pricing
What Navia charges you For life
Equity delivery brokerage₹0
Equity intraday brokerage₹0
Annual maintenance (AMC)₹0
Account opening₹0
Demat accountFree
Statutory & regulatory chargesAt actuals
More stays invested & compounding
Frequently asked

Equity, explained.

Yes. Navia charges ₹0 brokerage on equity delivery and intraday across NSE and BSE, for life. You pay only statutory charges (STT, exchange transaction charges, SEBI fee, GST and stamp duty) and a ₹30 DP charge per scrip when you sell shares from demat.

Opening a Demat and trading account with Navia is free. There is no account-opening charge and no annual maintenance charge (AMC) on the demat account, for life.

With Navia's Insta Funds, withdrawals reach your bank account in under 10 seconds, any time of day. Sale proceeds become available as per the standard exchange settlement cycle.

Yes. A single Navia account lets you trade and invest in 1500+ stocks across both the NSE and BSE at ₹0 brokerage.

When you sell shares held in demat, a DP (Depository Participant) charge of ₹30 per scrip applies along with statutory charges. There is no brokerage on equity delivery or intraday at Navia.

Yes. The Holding Allocation view charts every holding by its current market value (LTP × quantity), and calls out your largest position and your top-3 concentration, so you can see at a glance whether your portfolio is more concentrated than you intended. A table below lists each stock's quantity, LTP, current value and allocation percentage.

Yes. Any stock can be charted against the NIFTY over 1, 3 or 5 years, with both rebased to a common start so the comparison is like-for-like. The chart shows each return alongside the relative gap — so you can tell whether a holding actually beat the index or simply moved with it.

Yes. The Portfolio vs NIFTY view rebases your entire current basket to 100 alongside the index over 1, 3 or 5 years, and shows both returns with the relative gap — so you can see whether your stock-picking actually added anything over simply buying the index. It is a backtest of your holdings at today's quantities, not a record of your actual buy and sell history.

Yes. On the web platform the market watch can be expanded into a full-width table showing LTP, change in percent and rupees, volume, open interest and best bid together, with BUY and SELL buttons on every row. You get up to six watchlists, tag-based grouping and inline symbol search — the density of an installed terminal, straight in the browser with nothing to download.

Yes. You can pledge your equity holdings as collateral to get additional trading margin directly from the Navia app, and unpledge them when no longer needed.

From the Navia blog

Stock market insights.

The latest market thinking, how-tos and ideas on equity investing from our team.

Loading…

Fetching the latest articles…

Read all trading articles

Start investing in stocks today.

Free account, ₹0 delivery brokerage, 5-minute setup.