ETF Pricing: NAV, iNAV & Fair Value Explained
- What is NAV?
- What is iNAV?
- Difference Between NAV And iNAV
- Fair Value and Market Price
- Gold And Silver ETF Pricing – How Commodity ETFs Work
- Why it Matters to Investors?
- ETF Pricing Checklist for Investors
- Conclusion
- Frequently Asked Questions
ETF pricing can look confusing at first because an ETF has both a market price and a reference value based on its underlying holdings. For investors trying to understand what is iNAV, the key idea is that ETFs trade on the exchange like stocks, but their value is linked to the assets they hold.
This is why terms like NAV, iNAV, fair value, and premium or discount matter so much. If you want to compare ETF market price and reference values, you need to know how these numbers work together.
What is NAV?
NAV stands for Net Asset Value, and it reflects the value of the fund’s underlying assets after subtracting liabilities. In ETF language, how NAV calculated is usually based on the market value of the holdings divided by the number of outstanding units.
The formula is;
NAV per Unit = (Total Market Value of Assets – Liabilities) / Total Outstanding Units
A simple way to think about NAV is that it shows the unit’s underlying value at a point in time, usually based on end-of-day calculations. That is why NAV examples are useful for beginners: if a fund owns assets worth more and has fewer units, the NAV per unit may differ.
How NAV Changes Over Time?
🔹 Market Movement: If the underlying stocks rise, NAV rises proportionally
🔹 Expense Ratio Drag: Annual management fees erode NAV gradually (e.g., 0.10% p.a. = 0.000274% deducted daily)
🔹 Dividend Passthrough: When holdings pay dividends, NAV adjusts after distribution
🔹 Unit Creation/Redemption: New unit issuance does not dilute NAV; it is always value-neutral
What is iNAV?
What is iNAV in etf is one of the most important questions for ETF investors because iNAV gives an intraday estimate of the ETF’s fair value. iNAV stands for Indicative Net Asset Value, and it updates during market hours to help investors compare ETF price with underlying value.
The formula is;
iNAV = Sigma(Quantity x Live Market Price) – Accrued Liabilities / Outstanding Units
In simple terms, iNAV in ETF acts like a real-time reference number. It helps investors see whether the ETF is trading at a premium or discount compared to the value of its holdings.
iNAV Limitations — What Most Investors Miss

Difference Between NAV And iNAV
| Features | Net Asset Value (NAV) | Indicative Net Asset Value (iNAV) |
|---|---|---|
| Full Form | Net Asset Value | Intraday Net Asset Value / Indicative Net Asset Value |
| Definition | The official per-share value of a fund is based on closing market prices. | A real-time, intraday estimate of an ETF’s per-share value. |
| When Calculated | Once a day, after market close | During market hours, usually updated frequently such as every 15 seconds |
| Use Case | Fund house / AMC | Exchange or third-party data provider |
| Purpose | Shows the official daily value of the fund | Helps investors judge whether an ETF is trading at a premium or discount |
| Price Nature | Final official value for the day | Indicative, not the actual traded market price |
Fair Value and Market Price
Fair value vs intrinsic value is another useful concept here. Fair value in ETF pricing usually refers to the estimated worth of the ETF based on its underlying assets, while intrinsic value is a broader investing term often used to describe an asset’s true worth.
In ETF investing, iNAV is commonly used as a fair-value reference. If the market price is above iNAV, the ETF may be trading at a premium; if it is below iNAV, it may be trading at a discount.
Real-World Intraday Premium/Discount Tracker — Hypothetical ETF
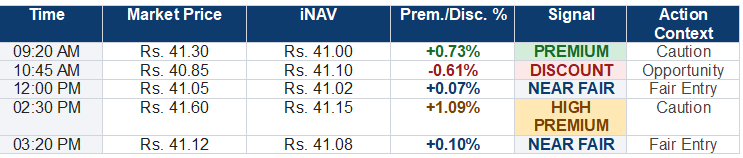
A significant premium or discount may indicate that the ETF market price differs from the estimated value of its underlying holdings. Investors may wish to understand the reasons for such differences before making investment decisions.
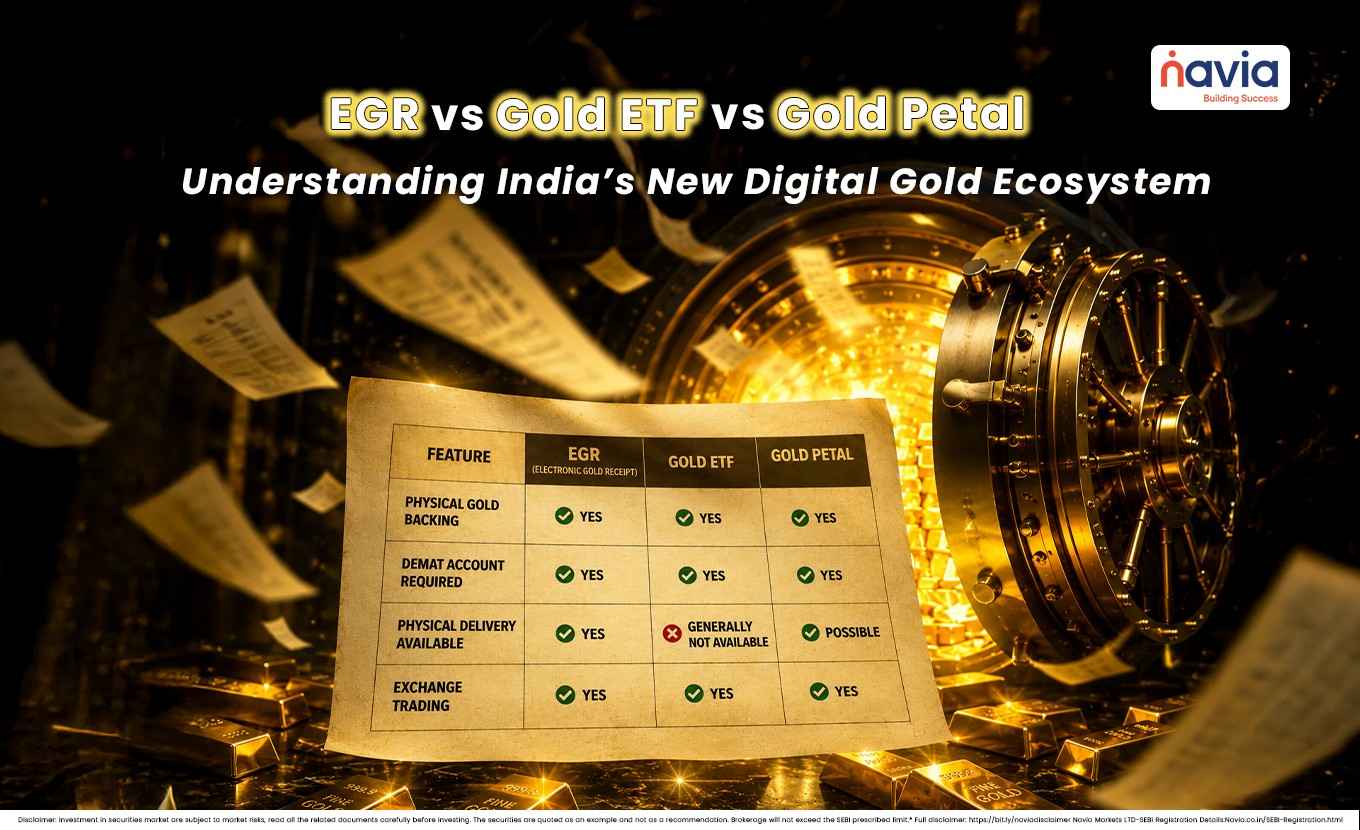
Gold And Silver ETF Pricing – How Commodity ETFs Work
A common question is how gold ETF price is calculated. In general, the ETF price is linked to the market value of the underlying gold held by the fund, adjusted for fund expenses and tracking differences.
Gold ETF NAV is generally linked to the value of the underlying gold holdings after accounting for expenses and other scheme-related adjustments.
Physical backing: Each unit of a Gold ETF is backed by a specific quantity of physical gold, held in SEBI-approved vaults
Spot price reference: The NAV tracks the LBMA (London Bullion Market Association) AM/PM fix, converted to INR using RBI reference rates
Expense ratio drag: A 0.50% annual expense ratio means the ETF’s gold backing slightly reduces relative to the spot price over time
Vault audit: SEBI requires semi-annual physical audits of gold held in custody to ensure 100% backing
The same logic applies to silver ETFs, which is why investors often search for silver ETF price chart and ETF gold price chart to compare price movement with the commodity’s market value. These charts help readers see whether the ETF is reflecting movements in the underlying commodity.
Why it Matters to Investors?
Understanding ETF pricing helps investors compare market prices with underlying fund values. By checking NAV and iNAV, investors can compare the market price with the ETF’s underlying value before making an investment decision. This is particularly useful for commodity ETFs and other funds where price swings can be fast. A quick check of these values can support ETF analysis.
ETF Pricing Checklist for Investors
🔸 Check iNAV before placing any order-especially for less liquid ETFs
🔸 Compare the current market price against iNAV to calculate the premium or discount percentage
🔸 Premiums, discounts, and spreads may vary throughout the trading session, including near market open and close
🔸 Investors may consider evaluating liquidity, trading volume, and bid-ask spreads before placing ETF orders
🔸 Tracking difference may help investors understand how closely the ETF has followed its benchmark over time
🔸 For Gold ETFs, cross-check the NAV against the LBMA spot price converted to INR
🔸 For international ETFs, check if the underlying market is open when trading
Conclusion
ETF pricing becomes much easier to understand once you separate NAV, iNAV, and market price. NAV shows the fund’s underlying value; iNAV gives a real-time estimate, and market price reflects what buyers and sellers are willing to trade at.
For anyone researching what is iNAV, difference between NAV and iNAV, or how gold ETF price is calculated, the core lesson is: compare the ETF’s trading price with its reference value during ETF evaluation. This comparison can provide additional pricing context.
Do You Find This Interesting?
We’d Love to Hear from you-

Frequently Asked Questions
What is iNAV in ETF?
iNAV is the indicative net asset value of an ETF, shown intraday as a fair-value reference.
What is the difference between NAV and iNAV?
NAV is usually calculated at the end of the day, while iNAV is updated during trading hours.
How NAV calculated?
NAV is generally calculated from the market value of the fund’s assets minus liabilities, divided by the number of units.
What is fair value vs intrinsic value?
Fair value is the estimated current worth used for comparison, while intrinsic value is a broader estimate of true worth.
Why check iNAV before buying an ETF?
It helps investors judge whether the ETF is trading close to its underlying value.
DISCLAIMER: Investment in securities market are subject to market risks, read all the related documents carefully before investing. The securities quoted are exemplary and are not recommendatory. Full disclaimer: https://bit.ly/naviadisclaimer.