


Understanding the Ascending Triangle Pattern in Technical Analysis
- What is the Ascending Triangle Pattern?
- Key Characteristics of the Ascending Triangle Pattern
- How to Identify the Ascending Triangle Pattern
- Trading the Ascending Triangle Pattern
- Entry Point
- Stop-Loss
- Target Price
- Numerical Example of an Ascending Triangle Pattern
- Significance of Volume Spikes in the Ascending Triangle Pattern
- Example of an Ascending Triangle Pattern with Volume Spike
- When Does the Ascending Triangle Pattern Occur?
- Trading Strategies for Ascending Triangle Patterns
- Conclusion
- Key Takeaways
- Frequently Asked Questions
The Ascending Triangle Pattern is a well-known bullish continuation pattern used in technical analysis. It signals a potential upward breakout and continuation of a previous uptrend. The Ascending Triangle is characterized by a horizontal resistance level and an upward-sloping support line, forming a triangular shape. This pattern indicates increasing buying pressure as the price forms higher lows, eventually leading to a breakout above the resistance level.
In this article, we will explore the key characteristics of the Ascending Triangle Pattern, explain how to identify it, discuss target prices and stop-loss strategies, and provide examples to simplify its understanding.
💡 Quick Answer
The Ascending Triangle is a bullish continuation pattern formed by a horizontal resistance level and an upward-sloping support line connecting higher lows. The converging lines show buying pressure building. A breakout above resistance, confirmed by a spike in volume, signals the uptrend is likely to continue.
What is the Ascending Triangle Pattern?
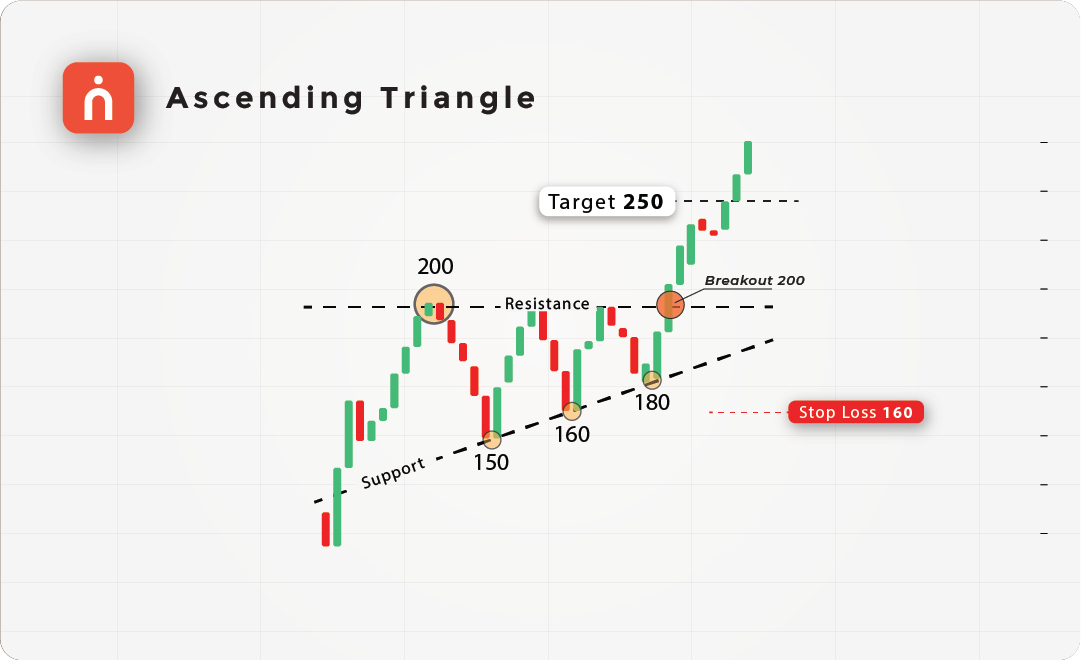
The Ascending Triangle Pattern typically forms during an uptrend and is a continuation pattern, meaning it usually indicates that the price will break out to the upside. The pattern forms as the price consolidates between a horizontal resistance line (where the price repeatedly fails to break higher) and an upward-sloping support line (indicating higher lows as buyers become more aggressive).
Once the price breaks above the resistance level with strong volume, the uptrend is likely to continue, and the pattern is considered confirmed.
Key Characteristics of the Ascending Triangle Pattern
- Horizontal Resistance:
The price encounters a resistance level multiple times, where it fails to break higher. This resistance line is flat and horizontal, representing a key level that sellers are defending. - Upward-Sloping Support:
The price forms higher lows over time, creating an upward-sloping trendline that converges toward the resistance level. This shows increasing buying pressure, as buyers step in at progressively higher levels. - Converging Trendlines:
The resistance line and the upward-sloping support line converge, forming the ascending triangle shape. The pattern suggests that the market is coiling up, preparing for a breakout. - Volume:
Volume often decreases during the consolidation phase of the pattern and spikes when the price breaks out above the resistance level.
How to Identify the Ascending Triangle Pattern
1) Spot the Horizontal Resistance:
Look for a horizontal resistance level where the price consistently fails to move higher. The more times the price touches this level without breaking through, the stronger the resistance becomes.
2) Identify the Upward-Sloping Support:
The price should form higher lows, indicating that buyers are becoming more aggressive and stepping in at higher price points.
3) Wait for the Breakout:
The pattern is confirmed when the price breaks out above the horizontal resistance level. This breakout should be accompanied by an increase in volume, indicating strong buying interest.
4) Measure the Height:
Measure the height of the pattern (the distance between the horizontal resistance and the lowest point of the support line). This distance is used to project the target price once the breakout occurs.
Trading the Ascending Triangle Pattern
Entry Point
Enter a long position when the price breaks above the horizontal resistance line with significant volume.
Stop-Loss
Place your stop-loss just below the upward-sloping support line or the lowest point within the triangle to protect against false breakouts.
Target Price
The target price is typically calculated by measuring the height of the triangle (the distance between the resistance and the lowest point of the triangle) and adding this distance to the breakout point.
Numerical Example of an Ascending Triangle Pattern
Let’s break down a simple example of an ascending triangle pattern using numbers.
| Action | Price (₹) | Description |
|---|---|---|
| Resistance Level | 200 | Price repeatedly fails to break above ₹200 |
| First Support | 150 | Price finds support at ₹150 |
| Higher Low | 160 | Price forms a higher low at ₹160 |
| Second Higher Low | 180 | Price forms another higher low at ₹180 |
| Breakout | 200+ | Price breaks above ₹200 with strong volume |
| Target Price | 250 | Target = ₹200 + (₹200 – ₹150) = ₹250 |
| Stop-Loss | 160 | Stop-loss placed just below ₹180 |
In this example, the price faces resistance at ₹200 multiple times, while forming higher lows at ₹150, ₹160, and ₹180. This creates the ascending triangle pattern, indicating that buyers are becoming more aggressive. When the price breaks above ₹200, the target is calculated by adding the height of the triangle (₹50) to the breakout point, resulting in a target of ₹250. The stop-loss is placed just below the last higher low at ₹180.
Significance of Volume Spikes in the Ascending Triangle Pattern
- Volume spikes are crucial for confirming the breakout in an ascending triangle pattern. Here’s why:
- Volume Declines During Consolidation:
As the pattern forms, volume tends to decrease, indicating reduced trading activity during the consolidation phase. This suggests that the market is preparing for a breakout. - Volume Spike at Breakout:
When the price finally breaks above the horizontal resistance line, a surge in volume indicates strong market participation. This volume spike confirms that the breakout is genuine and not a false move. - Avoiding False Breakouts:
If the breakout occurs without a volume spike, there’s a risk that the breakout could be a false signal. Waiting for increased volume helps confirm the strength of the breakout.
Example of an Ascending Triangle Pattern with Volume Spike
Let’s consider another example:
| Action | Price (₹) | Volume | Description |
|---|---|---|---|
| Resistance Level | 100 | 1,00,000 | Price repeatedly faces resistance at ₹100 |
| Higher Low | 90 | 70,000 | Price forms a higher low at ₹90 |
| Second Higher Low | 95 | 60,000 | Price forms another higher low at ₹95 |
| Breakout | 100+ | 1,50,000 | Price breaks above ₹100 with a volume spike |
| Target Price | 110 | Target = ₹100 + (₹100 – ₹90) = ₹110 | |
| Stop-Loss | 95 | Stop-loss placed just below ₹95 |
In this case, the price faces resistance at ₹100, while forming higher lows at ₹90 and ₹95, creating the ascending triangle pattern. When the price breaks out above ₹100 with a volume spike (from 60,000 shares to 1,50,000 shares), the breakout is confirmed, and traders can set a target of ₹110 based on the height of the triangle.
When Does the Ascending Triangle Pattern Occur?
The Ascending Triangle Pattern typically forms during an uptrend, indicating a period of consolidation before the uptrend resumes. It occurs when buyers are becoming more aggressive, pushing prices higher, while sellers are defending a key resistance level. The pattern is often seen in bullish markets, especially during periods of strong demand for a stock or asset.
Trading Strategies for Ascending Triangle Patterns
1. Bullish Markets:
The ascending triangle pattern is most commonly seen in bullish markets, where the price is trending upward. Traders can look for buying opportunities when the price breaks above the resistance level.
2. Volume-Based Confirmation:
A volume spike at the breakout is essential to confirm the strength of the move. If the breakout occurs without significant volume, traders should be cautious as it could indicate a false breakout.
3. Target and Stop-Loss Setting:
Measure the height of the triangle to set a realistic target price and use the last higher low as a stop-loss level to manage risk effectively.

Conclusion
The Ascending Triangle Pattern is a reliable bullish continuation pattern that provides traders with clear signals for entering the market. By identifying the horizontal resistance, upward-sloping support, and waiting for a volume-confirmed breakout, traders can effectively capitalize on this pattern.
With defined entry points, stop-loss levels, and target prices, the ascending triangle offers a structured approach to trading, allowing traders to benefit from strong uptrends while managing risk.
Key Takeaways
- The Ascending Triangle is a bullish continuation pattern with flat resistance and rising support.
- Higher lows show buyers stepping in at progressively higher levels.
- Volume falls during consolidation and spikes at the breakout above resistance.
- Target = height of the triangle added to the breakout point.
- A breakout without a volume spike risks being a false signal.
Related guides: Candlestick patterns · Cup and Handle pattern · Rising Wedge pattern · Volume in reversal patterns · Bollinger Bands
Frequently Asked Questions
What is the Ascending Triangle pattern?
The Ascending Triangle Pattern is a bullish continuation pattern characterised by a horizontal resistance level and an upward-sloping support line, forming a triangular shape. It indicates increasing buying pressure as the price forms higher lows.
Is the Ascending Triangle bullish or bearish?
It is bullish. The pattern typically forms during an uptrend and usually indicates that the price will break out to the upside once it clears the horizontal resistance level.
How do you identify an Ascending Triangle?
Spot a horizontal resistance level where price consistently fails to move higher, identify higher lows forming an upward-sloping support line, and wait for a breakout above the resistance accompanied by an increase in volume.
How do you calculate the target price for an Ascending Triangle?
Measure the height of the triangle — the distance between the resistance and the lowest point of the triangle — and add this distance to the breakout point.
Why is volume important in an Ascending Triangle?
Volume often decreases during the consolidation phase and spikes when the price breaks out above the resistance level. If the breakout occurs without a volume spike, there is a risk that the breakout could be a false signal.
Do You Find This Interesting?
We’d Love to Hear from you-

DISCLAIMER: Investments in the securities market are subject to market risks, read all the related documents carefully before investing. The securities quoted are exemplary and are not recommendatory. Brokerage will not exceed the SEBI prescribed limit.
Full disclaimer: https://bit.ly/naviadisclaimer


