Weekly Wrap-Up (JAN 08 – JAN 12, 2024)

The Indian market rebounded from the losses of the previous week to achieve new record highs by the end of the volatile week concluded on January 12. This surge was primarily driven by the strength of IT stocks, positive global indicators, and optimism regarding a potential rate cut by the conclusion of the current financial year.
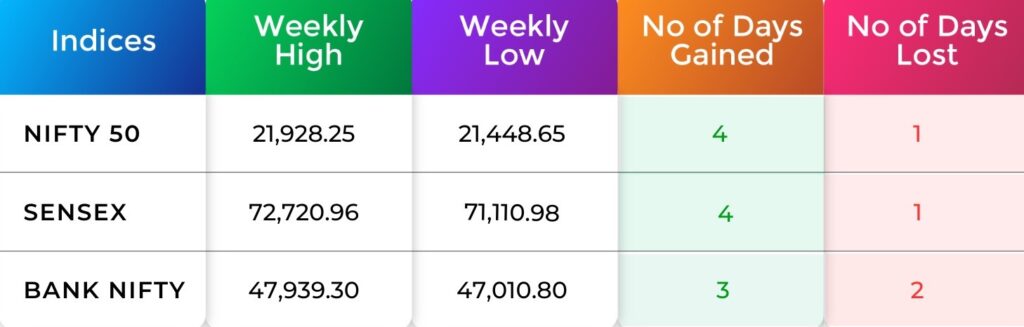
Indices Weekly Performance
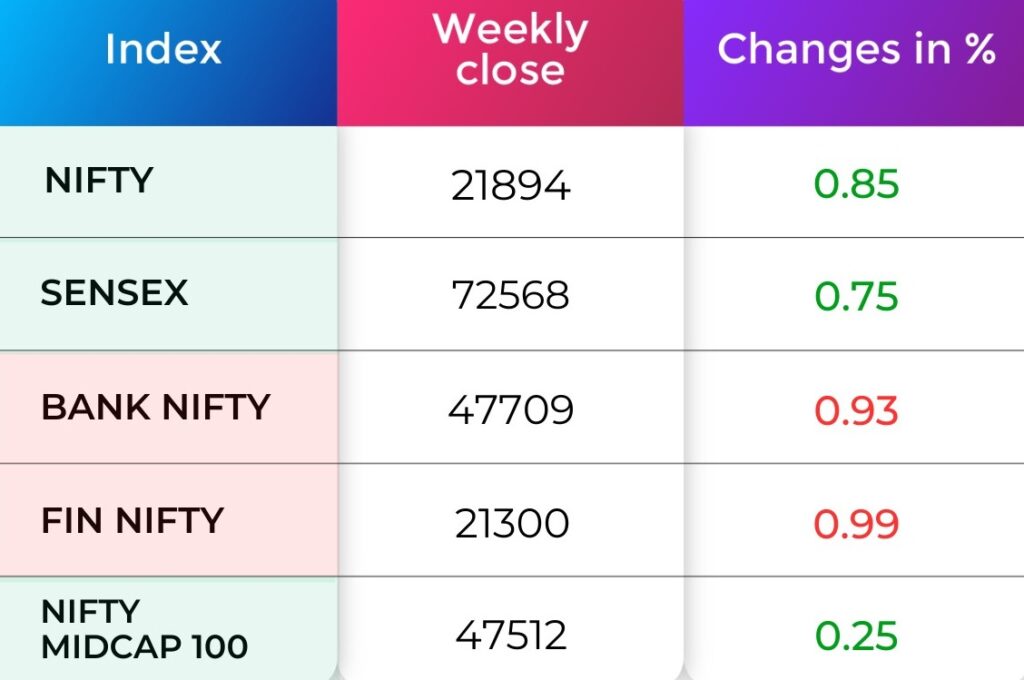
During the week, the BSE Sensex increased by 0.75 percent, concluding at 72,568. while the Nifty50 saw a gain of 0.85 percent, closing at 21,894. On January 12, both the Sensex and Nifty reached new record peaks of 72,720.96 and 21,928.25, respectively.
For any further queries, you can now contact us on WhatsApp!
Indices Analysis
NIFTY 50
The Nifty50 experienced a notable consolidation breakout, characterized by the emergence of a Bullish Flag & Pole pattern. This breakout, marked by a gap-up opening and a record closing high on January 12, was propelled by strong performances in technology stocks, particularly following the quarterly earnings of major IT companies.
Furthermore, a robust positive crossover was observed in the momentum indicator RSI (relative strength index), coupled with the consistent formation of higher highs and higher lows in successive sessions, supported by above-average trading volumes. Consequently, experts express confidence, suggesting that the index is poised to surpass the eagerly anticipated psychological milestone of 22,000 soon, with crucial support levels identified at 21,600-21,500.
BANK NIFTY
Bank Nifty joined the upward trend but lagged behind the Nifty50, experiencing a rise of 272 points to reach 47,710. The daily charts showed the formation of a bullish candlestick pattern with higher highs and higher lows.
As per technical analysis, Bank Nifty displayed a reversal in trend from downward to upward, evident from the formation of higher tops and higher bottoms on the daily charts. The expectation is for the positive momentum to persist, with a target of 48,000 in the immediate term and a potential extension to 48,500 beyond that.
On the weekly charts, the banking index exhibited a bearish candlestick pattern with a pronounced lower shadow, resulting in a 0.93 percent correction. Overall, the weekly charts suggest consolidation in the banking index, with support identified in the range of 46,900-47,000.
Nifty Chart
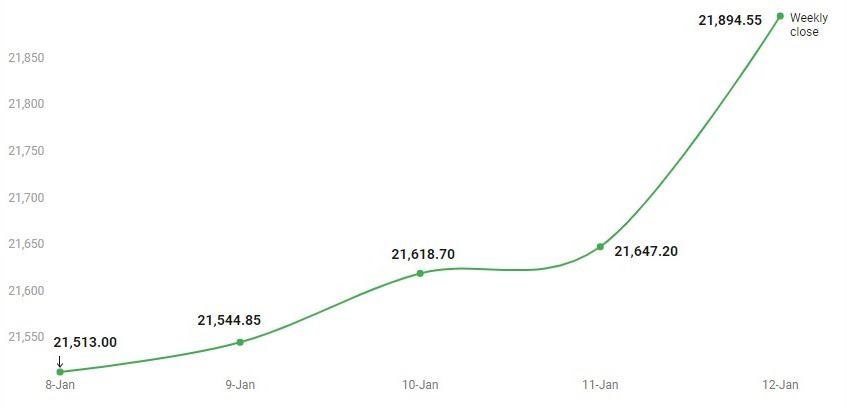
On Friday The Nifty 50 started on a positive note at 21,774 and climbed higher as the day progressed to hit a fresh all-time high of 21,928. Finally, the index ended at a new closing high of 21,895, up 247 points or 1.14 percent, while on the weekly charts, there was a bullish candlestick pattern formation with a long lower shadow indicating strong buying interest at lower levels.
Now with N Coins, Navia customers can actually #Trade4Free.
INDIA VIX
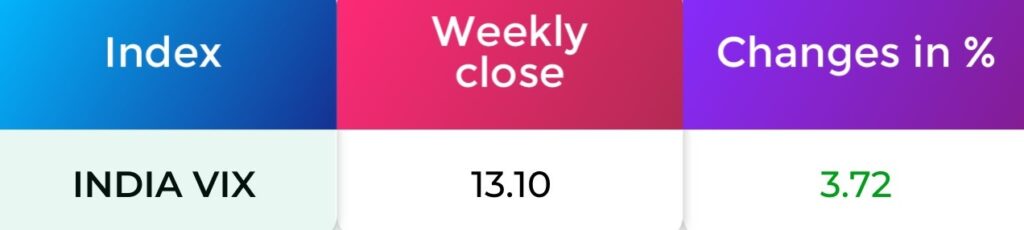
The India VIX (Volatility Index) weekly close stands at 13.10, with a percentage change of +3.72 over the past week. This suggests that there has been an increase in market volatility during the week. A positive change in the VIX indicates a rise in expectations for market volatility
Refer your Friends and family and GET 500 N Coins.
Use N Coins to Redeem all Charges. #Trade4Free.
Sectoral Performance
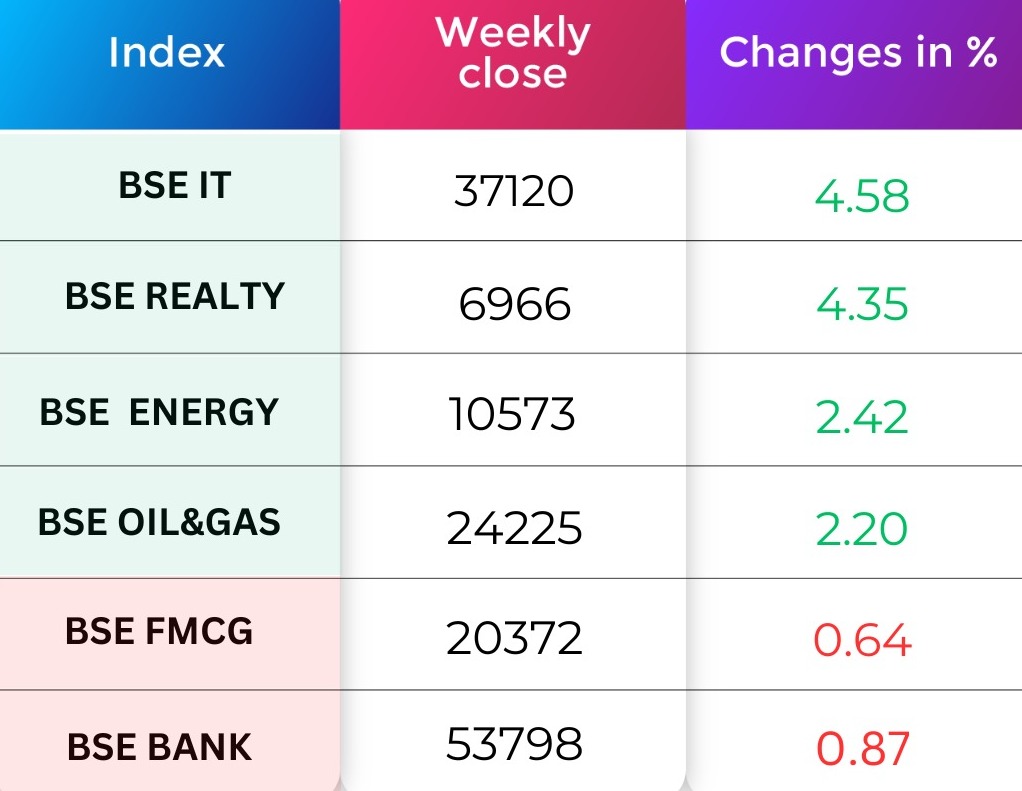
On the sectoral front, notable performances were observed with the BSE Information Technology index rising by 4.58 percent. Similarly, the BSE Realty index experienced a gain of 4.35 percent. Additionally, the BSE Energy and BSE Oil & Gas indices displayed positive trends with increases of 2.42 percent and 2.20 percent, respectively.
However, contrasting this positive trend, the BSE FMCG index witnessed a decline of 0.64 percent, and the BSE Bank index recorded a decrease of 0.87 percent.
FII & DII Weekly Activity
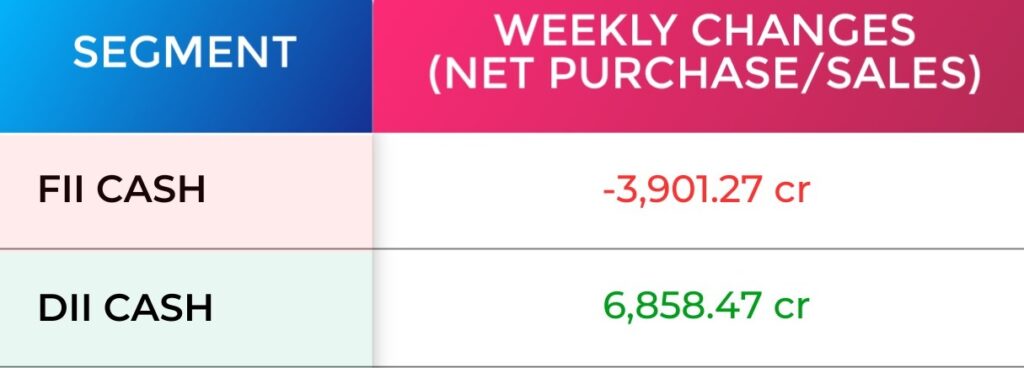
Foreign institutional investors (FIIs) sold equities worth of Rs 3,901.27 crore, while Domestic institutional investors (DIIs) bought equities worth Rs 6,858.47 crore.
Global Market
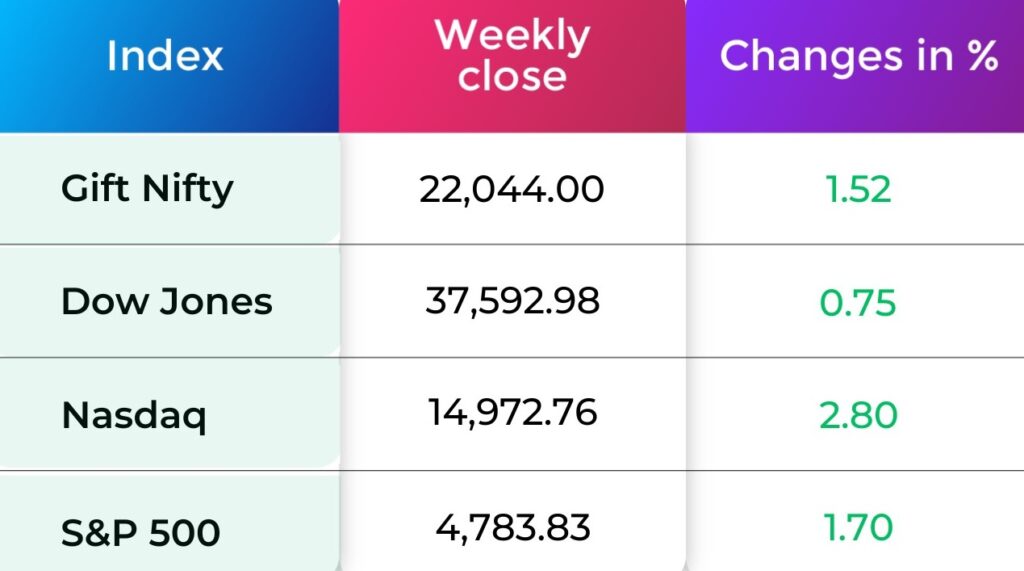
The Dow Jones Industrial Average, the S&P 500, and the Nasdaq Composite all posted weekly gains, marking a reversal from last week’s market action.
The Dow closed up 0.75% this week, after marking its second-highest close on Thursday. The S&P, meanwhile, gained 1.70%, after touching its record close during intraday trading on Friday.
The Nasdaq, up 2.80% this week, marked its largest one-week gain since November.

Currency Indices
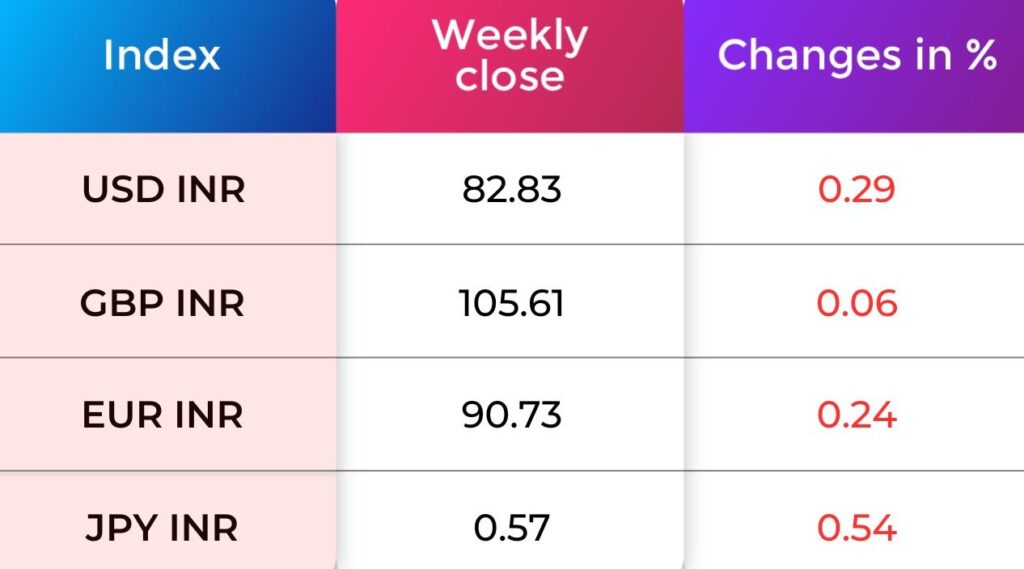
This week, the Indian rupee closed higher against the US dollar. The domestic currency gained 24 paise to end at 82.83 in the week ended January 12 against the January 5 closing of 83.16.
Poll of the week
Last week’s poll:
Q) Which key factor determines the next move in gold prices as per MCX?
a) Mid-east tensions
b) Recent fluctuations in the stock market
c) US inflation data
d) European Central Bank policies
Last week’s poll answer: c) US inflation data
Commodity Market
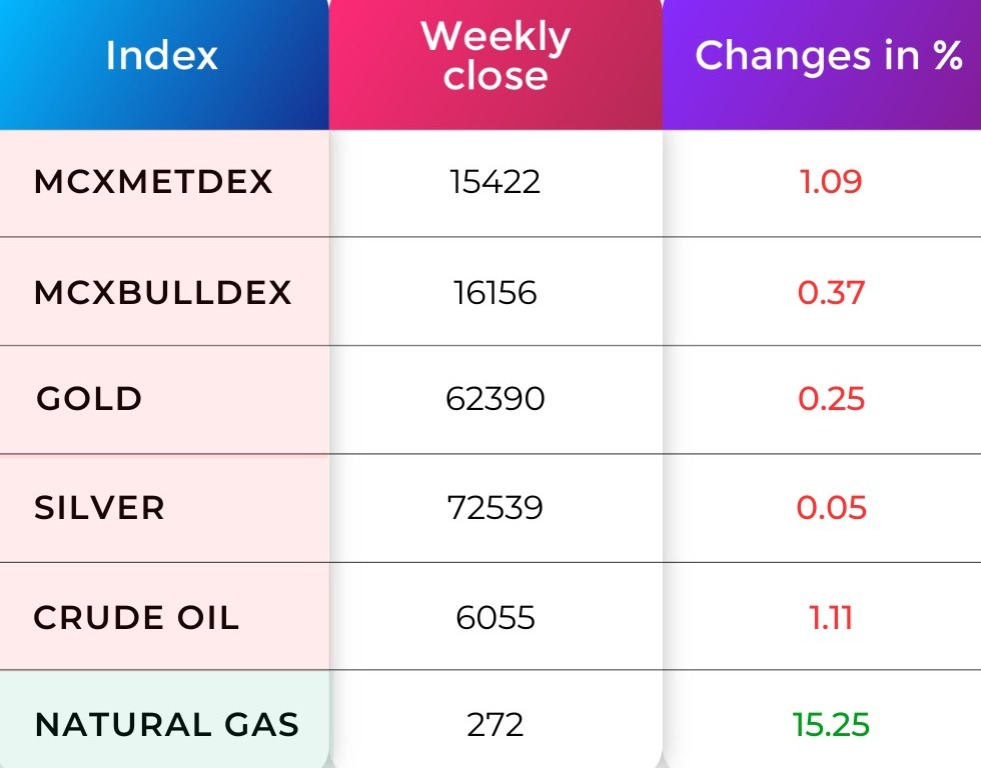
In Friday session, the gold formed a bearish candle and closed 0.34% negative. Escalation of geopolitical tension in the Middle East could enhance gold’s role as a safe-haven asset. This factor may influence the gold price in upcoming sessions. The current R1 is placed at 62,486, and S1 is placed at 61,322.
Natural gas is showing volatility throughout the Week. natural gas closed 15.25% positive. Natural gas may continue the volatility, supported by a larger-than-expected draw on inventories in the week through January. The current R1 is placed at 277, and S1 is placed at 245.
Did you Know?
California Spawned the Idea of Bull & Bear Markets
No one knows for sure where the terminology bears and bulls came from. The added mystery is why the bear is thought to be on the pessimistic and the bull on the optimistic side of the equation. One suggestion, although unproven, makes sense. In the 1800s, Californians entertained themselves with all sorts of unusual spectacles, including fighting matches between bulls and bears.
The two animals would be placed in an enclosed arena and allowed to battle each other for up to an hour. By the time the clock ran out, the bear was usually hiding behind a post while the bull was aggressively trying to gore the poor bear. Later, the analogy was applied to market traders, and the rest is history. Of course, no one has ever been able to substantiate that curious legend.
Refer your Friends & Family and GET 500 N Coins.
Use N Coins to Redeem all Charges. #Trade4Free.
Do you have a question? Ask here and we’ll publish the information in the coming weeks.

Do You Find This Interesting?

Happy Learning,
Team Tradeplus