How to Trade in Volatile Markets: Mastering Volatility Trading

Volatility – a term often associated with uncertainty, fear, and rapid market swings. For traders, it’s both a blessing and a curse, offering opportunities for profit while simultaneously posing risks of significant losses. But how can one navigate the tumultuous waters of volatile markets effectively? Let’s delve into the art of trading volatility and uncover strategies to thrive amidst market turbulence.
Understanding Volatility Trading
In trading, volatility serves as a yardstick to measure the dispersion of prices or returns over time for a specific asset. Essentially, it indicates the magnitude and frequency of price fluctuations. While volatility presents opportunities for profit, it also amplifies the potential for losses if not managed effectively.
Price action, closely intertwined with volatility, reflects market sentiment and trader behavior. By analyzing price movements, traders can gain insights into market dynamics and make informed trading decisions.
Why Markets Become Volatile 📈
Market volatility often surges in times of heightened uncertainty or fear among investors. Economic downturns, geopolitical tensions, or significant global events can trigger spikes in volatility, as witnessed during the 2008 financial crisis or the 2022 Russia-Ukraine conflict.
Volatility Trading Tips
🔸 Utilize Trendlines: Trendlines serve as invaluable guides in volatile markets, cutting through the noise to reveal underlying trends. Before entering a trade, draw trendlines to discern market direction and identify crucial support and resistance levels.
🔸 Avoid Herd Mentality: Resist the urge to blindly follow the crowd, driven by the fear of missing out (FOMO). Conduct thorough research and analysis before making trading decisions, steering clear of unsustainable trends.
🔸 Act Swiftly on News Developments: During significant market events, stay informed and position yourself strategically before news hits. Anticipate market reactions based on analyst predictions and related reports.
🔸 Consider Gap Filling Opportunities: Monitor market gaps that occur during non-trading hours and capitalize on opportunities to trade the subsequent price corrections.
🔸 Take Calculated Risks: Engage in trading around major economic news events cautiously, making educated guesses based on market sentiment and expectations. Set stops and limits wisely to mitigate potential losses.
Hedging Against Market Volatility
Protecting investments during market downturns is paramount for long-term investors. Consider employing protective measures such as purchasing put options to limit potential losses while safeguarding your portfolio against adverse market movements.
Here’s how it works: let’s say you own XYZ stock at $100 per share and want to limit potential losses to 20%. You can buy an 80-strike put option. This option gives you the right (but not the obligation) to sell your shares at $80, even if the market price drops to, say, $50. It’s like having an insurance policy that sets a minimum selling price for your shares, helping to safeguard your investment.
Identifying Volatile Stocks
→ Beta Index: Look for a beta value above 1, indicating higher volatility.
→ Trading Activity: Check for increased trading volume, a sign of volatility.
→ Price Fluctuations: Monitor significant price swings over short periods.
→ Risk Metrics: Consider indicators like open interest, put-call ratios, and implied volatility.
→ Market Sentiment: Pay attention to changes in investor sentiment and economic conditions.
→ Continuous Monitoring: Keep track of the stock’s performance over time for fluctuations.

Advantages of Volatile Stocks
Potential for High Returns: Volatile stocks can experience significant price movements, offering the opportunity for substantial gains in a short period.
Lower Market Demand: Since volatile stocks are often overlooked by conservative investors, they may be undervalued, providing buying opportunities for savvy traders.
Suits All Investment Goals: Whether you’re looking for short-term gains or long-term growth, volatile stocks can cater to a variety of investment strategies.
Opportunity in Market Fluctuations: Volatility creates frequent price fluctuations, allowing traders to capitalize on both upward and downward trends.
Challenges of Volatile Stocks
High Risk: The same volatility that offers profit potential also increases the risk of significant losses. Prices can swing unpredictably, leading to substantial declines in portfolio value.
Value Trap: Volatile stocks may appear attractive due to their price movements, but they can also be value traps, with prices fluctuating without underlying fundamentals to support them.
Sectoral Downtrends: Volatility in specific sectors or industries can be driven by external factors, such as regulatory changes or technological advancements, posing challenges for investors.
No Dividend Payouts: Some volatile stocks, particularly those in growth sectors, may not offer dividends. This can deter income-oriented investors who rely on regular dividend payments for returns.
Exploring Historic Volatility Cycles: An Overview
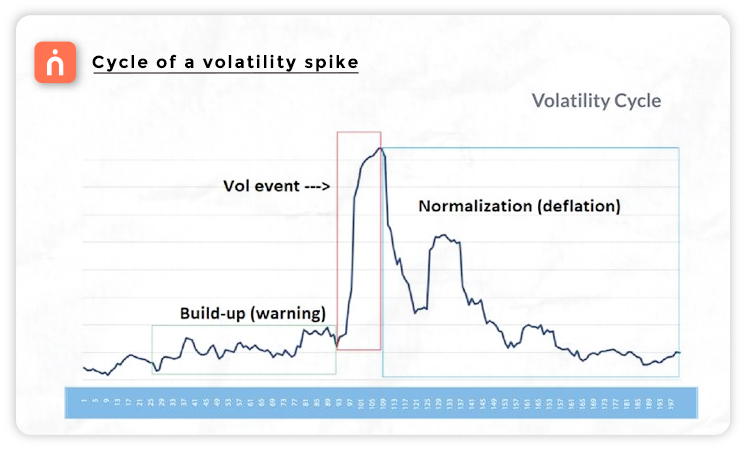
Understanding the historical context of market volatility is crucial for navigating turbulent financial landscapes. Let’s examine some of the most significant volatility cycles in major financial markets since 1929, exploring their build-up, peak, normalization phase, and after-effects.
🔹 Crash of 1929
At the close of the roaring ’20s bull market, the crash of 1929 marked the onset of the Great Depression of the 1930s. Notably, the October 28-29 crash saw a two-day loss of 24% in the Dow Jones Industrial Average, accompanied by a spike in two-week realized volatility to 127%. The market had already shown signs of weakness before the crash, with volatility rising from 11% to 81%. Following the initial decline, volatility normalized briefly before escalating again over the next two years.
🔹 Silver 1980
During the late 1970s and early 1980s, the Hunt brothers’ attempt to manipulate the price of Silver led to one of the most famous market ‘cornerings’ in history. Silver prices soared, accompanied by sharp increases in volatility, including a peak two-week realized volatility of 240%. However, volatility subsided relatively quickly after the peak, returning to 12% within five months.
🔹 Black Monday – 1987
The 1987 stock market crash in the United States, commonly known as Black Monday, was partially attributed to program trading and speculative excesses. Leading up to the crash, the market had already shown signs of instability, with a 16% decline in the S&P 500 and a rise in short-term volatility to 25%. Following the crash, volatility spiked to over 130% before gradually normalizing over the subsequent months.
🔹 Great Financial Crisis (GFC) 2008
The GFC was triggered by irresponsible banking practices, resulting in the largest stock market and economic decline since the Great Depression. Before the crisis intensified in the fall of 2008, two-week volatility had already reached 41%. As the crisis unfolded, volatility surged further, with the VIX index climbing from 36 to 80. Volatility eventually normalized over the following year, albeit at elevated levels compared to pre-crisis levels.
🔹 S&P 500 E-mini Flash Crash 2010
The S&P 500 e-mini futures experienced a significant flash crash on May 6, 2010, attributed in part to ‘spoofing’ by a London-based trader. Leading up to the crash, volatility had been increasing steadily, with the VIX rising from 15 to 40. Following the crash, volatility remained elevated for several weeks before gradually declining.
🔹 EURCHF Blow-Up 2015
The unexpected removal of the Swiss National Bank’s floor on the EUR/CHF exchange rate in 2015 led to a rapid collapse in the currency pair and a spike in volatility. Despite the swift normalization of prices, volatility remained elevated for several months following the event.
🔹 Brexit 2016
The Brexit vote in June 2016 resulted in significant market turmoil, with sterling plummeting and volatility spiking. Leading up to the vote, volatility had been steadily rising as market participants anticipated the outcome. While volatility initially subsided after the vote, it surged again during the Pound flash-crash in October.
🔹 Volpocalypse 2018
The ‘Volpocalypse’ of February 2018 saw a sudden spike in volatility following a period of unsustainable market growth. In the months preceding the event, U.S. stocks had surged, accompanied by an increase in volatility. The spike in volatility, exacerbated by heavy betting on low volatility levels, took several months to normalize.
In conclusion, mastering volatility trading demands a strategic approach that embraces opportunities while mitigating risks. By understanding market drivers, utilizing effective strategies, and hedging against downturns, traders can navigate turbulent markets with confidence. While volatility offers potential for profit, it requires discipline and adaptability. Learning from historical volatility cycles can provide valuable insights for navigating current market conditions. With vigilance and informed decision-making, traders can capitalize on volatility, turning uncertainty into opportunity and achieving their financial objectives.
We’d Love to Hear from you –