Weekly Wrap-Up (JAN 01 – JAN 05, 2024)

The initial week of the New Year saw Indian benchmark indices closed with slight losses, marked by volatility. This occurred despite reaching new record highs during the first trading session of 2024.
Indices Weekly Performance
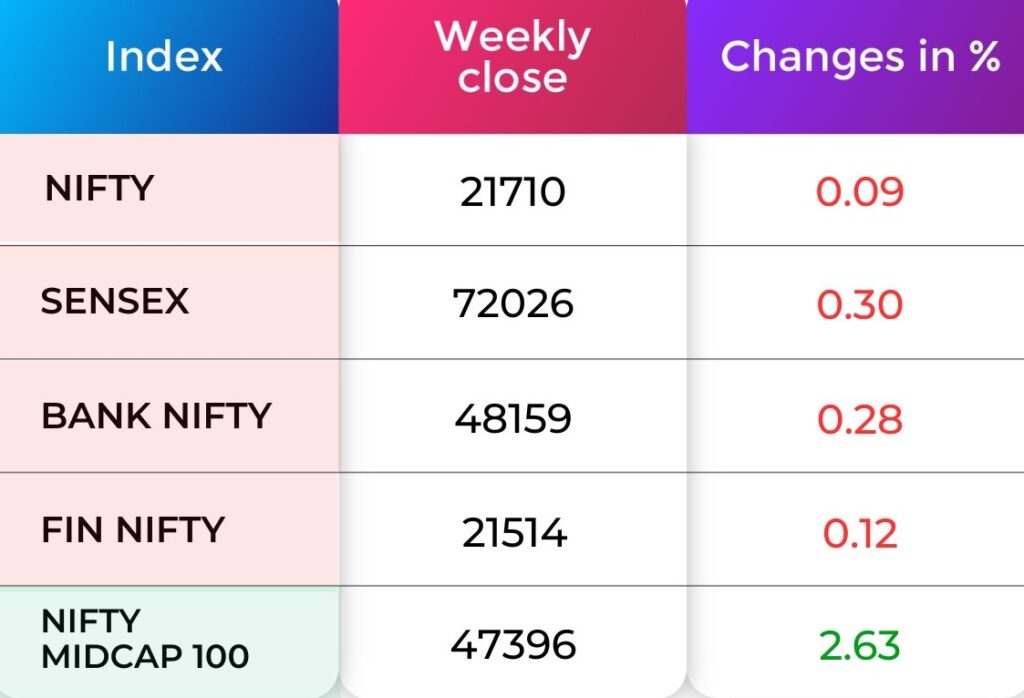
Throughout the week, the BSE Sensex experienced a decline of 0.30 percent, concluding at 72,026. Similarly, the Nifty50 finished at 21,710.
Indices Analysis
NIFTY 50
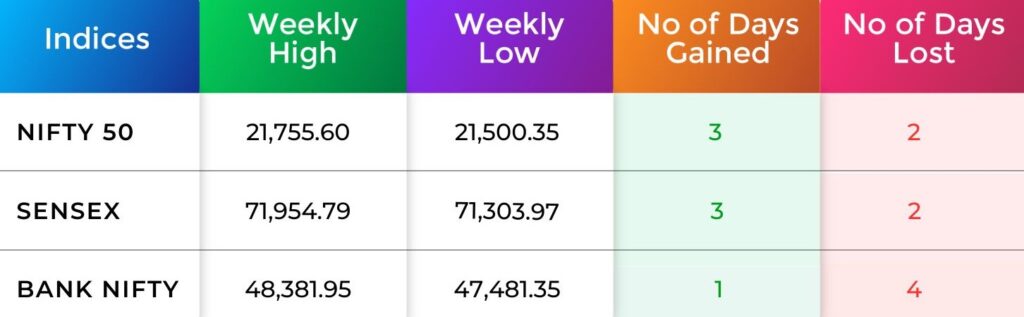
On Friday Nifty closed in the green after correcting for the previous couple of trading sessions. The fall in Nifty has halted around 21500 levels where multiple support parameters in the form of the 38.2% Fibonacci retracement level and the lower end of the rising channel are placed.
We expect Nifty to hold on to this support and resume the next leg of up move. The hourly momentum indicator has triggered a positive crossover which is a buy signal. Thus, we expect the positive momentum to continue over the next few trading sessions.
BANK NIFTY
The Nifty Bank index also witnessed volatility and ended on a flat note. The index managed to recover more than 300 points from the intraday low of 47,822.85 to close at 48,159.
Exhibiting a robust recovery from the 47,500 support level, Bank Nifty showcases active bullish activity, rebounding from the 14-day moving average support at 47,800. A closing above 48,200 is crucial, as it could propel the index towards 48,500 and 48,800 levels,
“The immediate support for Bank Nifty stands at 47,800, indicating a key level to monitor in the current market
Nifty Chart
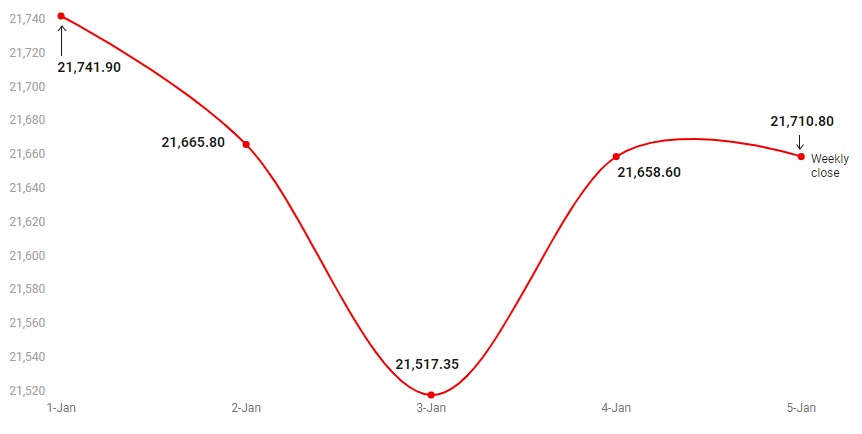
The present sentiment suggests a promising trajectory towards 21800-21850 for the Nifty. If it surpasses 21850, we might anticipate a further climb toward 22000. Notably, the index appears to have a short-term support level of around 21500. A downward shift would likely initiate only if it falls below this mark; until then, it seems favourable for buyers to take advantage of market dips.
Now with N Coins, Navia customers can actually #Trade4Free.
INDIA VIX
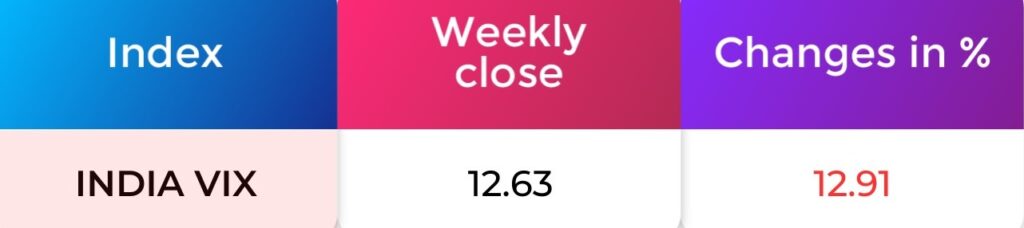
The India VIX value of 12.63 decreased by 12.91%. showing market volatility decreased
Refer your Friends and family and GET 500 N Coins.
Use N Coins to Redeem all Charges. #Trade4Free.
Sectoral Performance
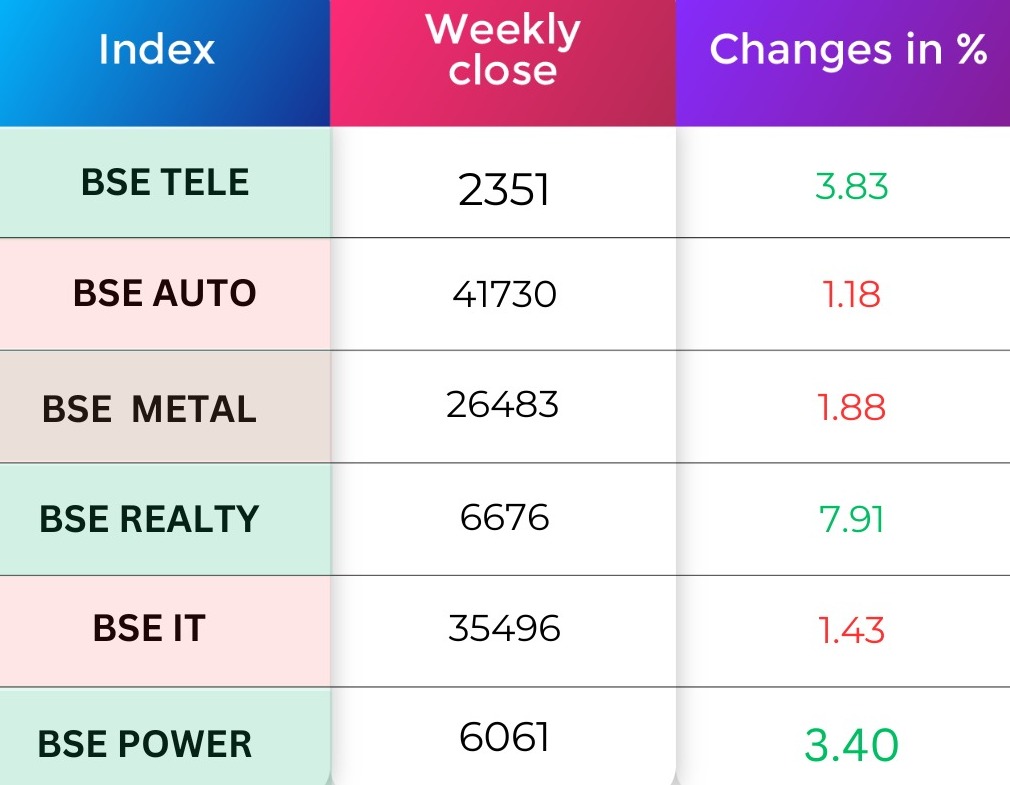
On the sectoral front, BSE Realty index added 7.9 percent, Telecom rose 3.83 percent, Power added 3.83 percent , while Auto lost 1.18 percent, Information Technology lost 1.43 percent and Metal lost 1.88 percent.
FII & DII Weekly Activity
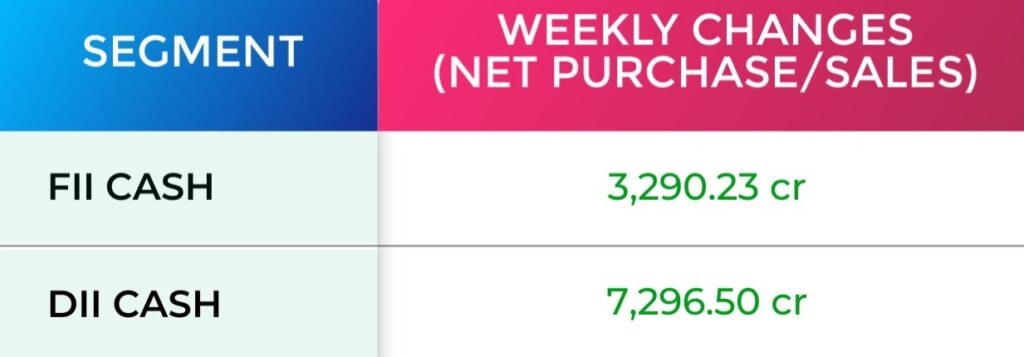
Foreign institutional investors (FIIs) remained net buyers in this week, as they bought equities worth of Rs 3,290.23 crore, while Domestic institutional investors (DIIs) sold equities worth Rs 7,296.50 crore.
Global Market
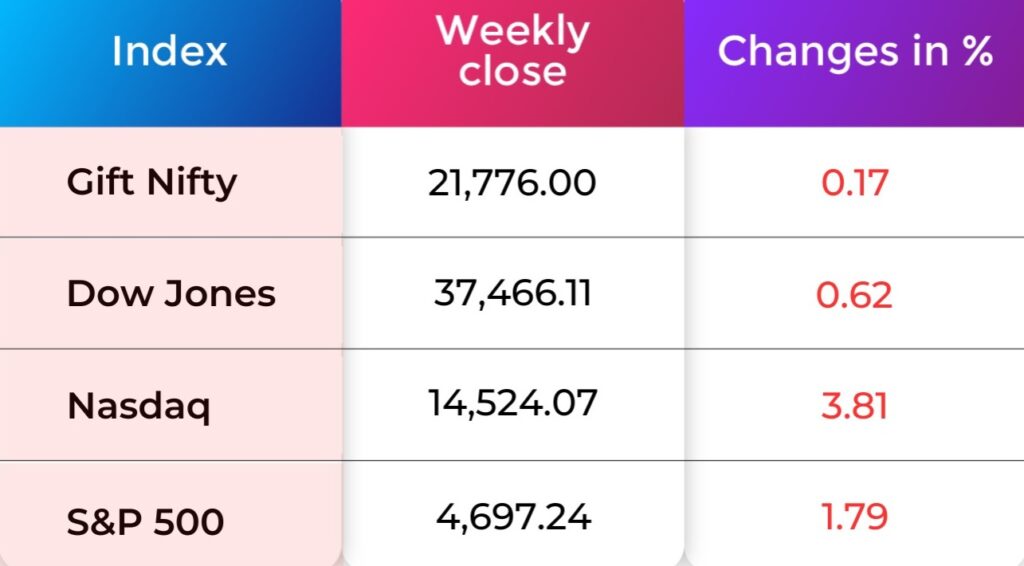
All three benchmarks recorded their first weekly declines for ten weeks: the S&P 500 dropped 1.79%, while the Nasdaq Composite slumped 3.81%, and the Dow Jones Industrial Average dipped 0.62%.
For the S&P 500, it was its worst weekly performance since late October, while the Nasdaq posted its worst week since late September.
Currency Indices
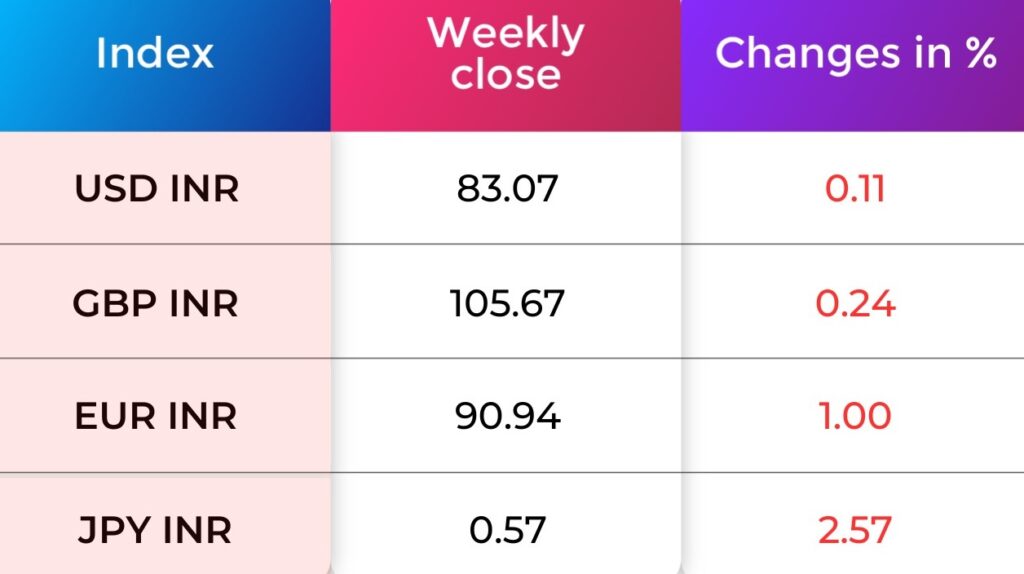
Indian rupee reported marginal gains against the US dollar, as the domestic unit closed at 83.07 in the week ended January 5 against December 29 closing of 83.20.
Poll of the week
Last week’s poll:
Q) What are the factors that influence the prices of Gold and Silver in India?
a) Only the value of rupee against the dollar
b) Only global demand
c) Both the value of rupee against the dollar and global demand
d) None of the above
Last week’s poll answer: c) Both the value of rupee against the dollar and global demand
Commodity Market
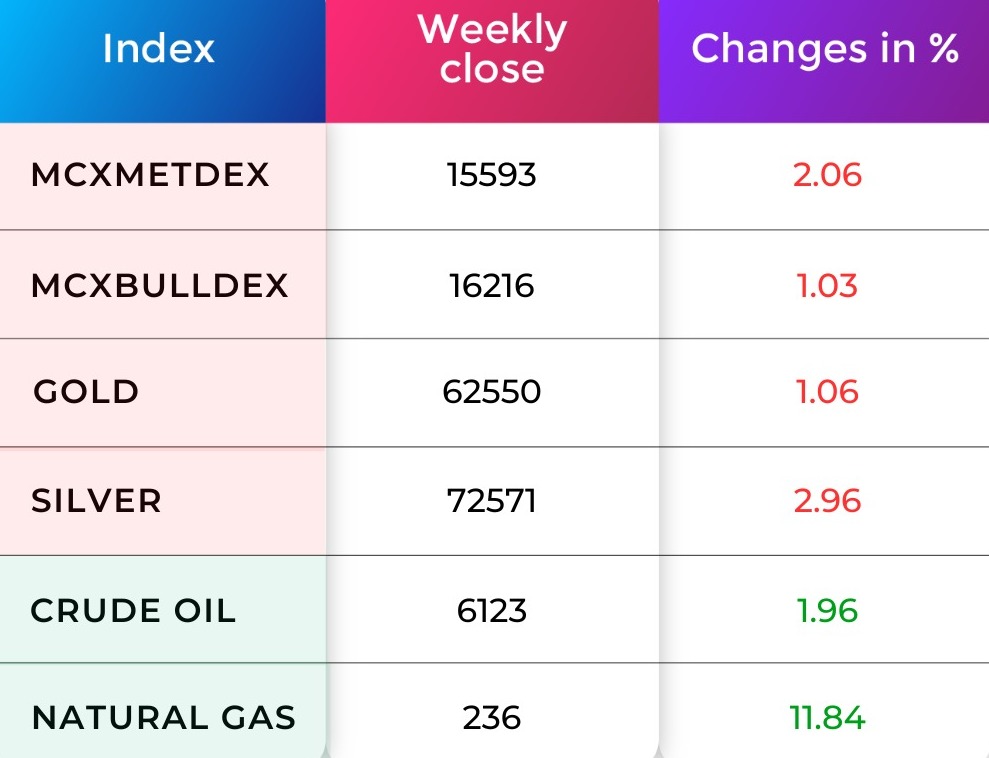
In the past week, crude oil formed a bullish candle and closed 1.96% positive. The Federal Reserve meeting suggested that inflation was under control. Additionally, U.S. Secretary of State Antony Blinken’s preparation to visit the Middle East to prevent escalation in the Israel-Gaza conflict influenced the upcoming price movement. The current R1 is placed at 6,250, and S1 is placed at 5,900.
The rebound in the dollar and Treasury yields, as traders scaled back bets on early and steep interest rate cuts from the US Federal Reserve this year, pressured the gold price to go down. In the previous week, gold closed 1.06% negative. The current R1 is placed at 63,151, and S1 is placed at 62,198.
Blogs of the week

Did you Know?
Did you know that Tax Saver Mutual Funds, commonly known as ELSS (Equity Linked Savings Scheme), might offer stability but often generate lower returns compared to other mutual funds? Despite having the flexibility to invest in a variety of stocks, including flexi-cap funds, these funds tend to gravitate towards large-cap stocks. Each tax-saver mutual fund adopts a unique investment style; some prioritize diversification, while others focus on specific sectors or market caps.
The key reason behind the comparatively lower returns lies in their emphasis on stability. Unlike riskier funds, tax-saver mutual funds prioritize a conservative approach to maintain a balanced portfolio and reduce volatility, even if it means accepting slightly lower returns. It’s crucial for investors to recognize that not all mutual funds, including tax-saver funds, deliver expected returns due to factors like market conditions or fund management decisions.
Before incorporating a tax-saver fund into your portfolio, conduct thorough research, considering your investment goals and risk tolerance. By understanding these dynamics, investors can make informed decisions aligned with their financial objectives. Explore the unique world of tax-saver mutual funds, where stability and lower returns coexist in pursuit of long-term financial security.
Refer your Friends & Family and GET 500 N Coins.
Use N Coins to Redeem all Charges. #Trade4Free.
Happy Learning,
Team Navia
We’d Love to Hear from you-
DISCLAIMER: Investments in the securities market are subject to market risks, read all the related documents carefully before investing. The securities quoted are exemplary and are not recommendatory. Brokerage will not exceed the SEBI prescribed limit.