


Pole vs Flag Pattern: The Key Difference You Need to Know
- What is the pole pattern?
- What is the flag pattern?
- Pole Pattern vs Flag Pattern: The Key Difference
- How to read the flag and pole pattern step by step?
- How to measure the move after a breakout?
- What are bullish and bearish flags?
- Why does trading volume matter?
- What are the limits of this chart pattern?
- Conclusion
- FREQUENTLY ASKED QUESTIONS
Many new traders confuse the pole pattern and flag pattern as separate formations. In fact, they represent two parts of one chart pattern. Together, they form the flag and pole pattern, a formation commonly discussed in technical analysis. This guide explains how each part develops, how traders identify it on a stock chart, and how a potential breakout may occur.
💡 Quick Answer
The pole is the sharp initial price move; the flag is the short consolidation that follows. Together they form the flag and pole pattern, a continuation pattern studied in technical analysis. Traders measure the flagpole to estimate a move after a breakout, but no chart pattern guarantees an outcome.
What is the pole pattern?
The pole pattern forms the first part of the flag and pole pattern. It shows a sharp price move in one direction over a relatively short period. The move can occur upward or downward and may reflect strong momentum. For example, a move from ₹500 to ₹650 creates a steep rise on the stock chart. Traders often examine price movement and trading volume when identifying a potential flagpole.
What is the flag pattern?
The flag pattern forms the second part of the flag and pole pattern. After the pole, price may pause and consolidate for a short period. This phase can move sideways or retrace slightly against the earlier trend.
On a stock chart, this consolidation may resemble a small rectangle that slopes against the preceding move. Traders can use parallel trendlines to outline the consolidation area.
The pattern itself does not guarantee a breakout or a particular price direction. It is one formation that traders may study as part of technical analysis.
Pole Pattern vs Flag Pattern: The Key Difference
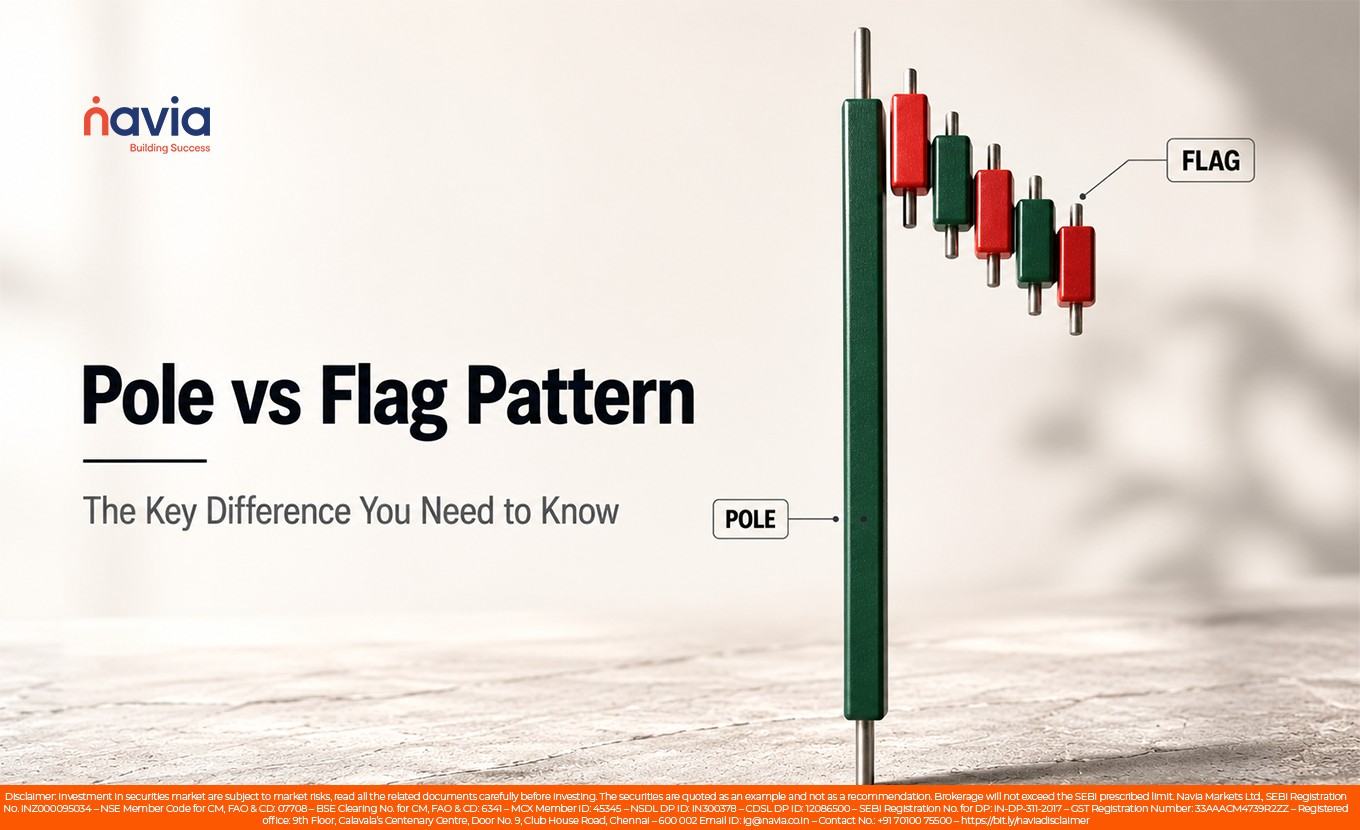
The pole represents the strong initial price move, while the flag represents a period of consolidation that follows.
The flag pattern develops after the pole and typically shows a brief pause or retracement. Together, they form the flag and pole pattern, a commonly studied chart pattern.
The name comes from its visual appearance. The pole resembles a flagpole, while the consolidation resembles a flag attached to it.
However, the pattern does not guarantee a breakout or a specific price movement.
How to read the flag and pole pattern step by step?
Reading the flag and pole pattern involves checking its structure, price movement, and trading volume.
- First, identify the flagpole as a steep price move accompanied by strong trading volume.
- Next, locate the flag, where price consolidates between two parallel trendlines.
- Then, assess the retracement relative to the flagpole. A deeper retracement may indicate a less typical continuation setup.
- Finally, examine trading volume during the consolidation and any subsequent breakout. Volume may contract during the flag and increase when price moves beyond the pattern.
The flag typically remains relatively short compared with the preceding move. Its duration can vary across different chart timeframes.
A flag and pole formation does not guarantee a breakout or continuation. Traders should consider other market factors before making decisions.
How to measure the move after a breakout?
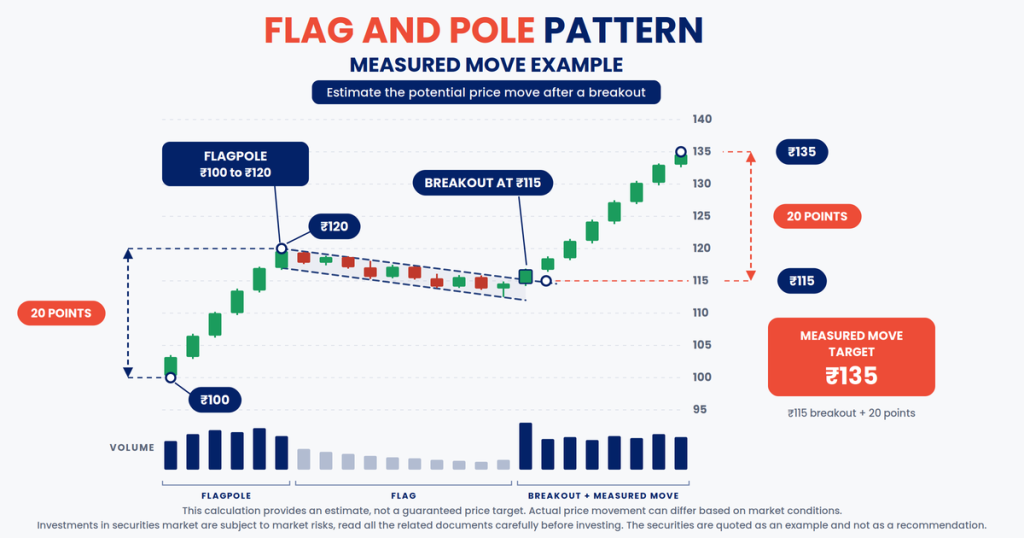
The flag and pole pattern can help traders estimate a potential price move after a breakout. This approach is often called a measured move.
First, measure the flagpole from its starting point to the point where the flag begins. For a bullish setup, traders may add that distance to the breakout level. For a bearish setup, they may subtract it.
For example, a flagpole moving from ₹100 to ₹120 covers 20 points. If the breakout occurs at ₹115, the measured move would reach ₹135.
This calculation provides an estimate, not a guaranteed price target. Actual price movement can differ based on market conditions and other factors.
What are bullish and bearish flags?
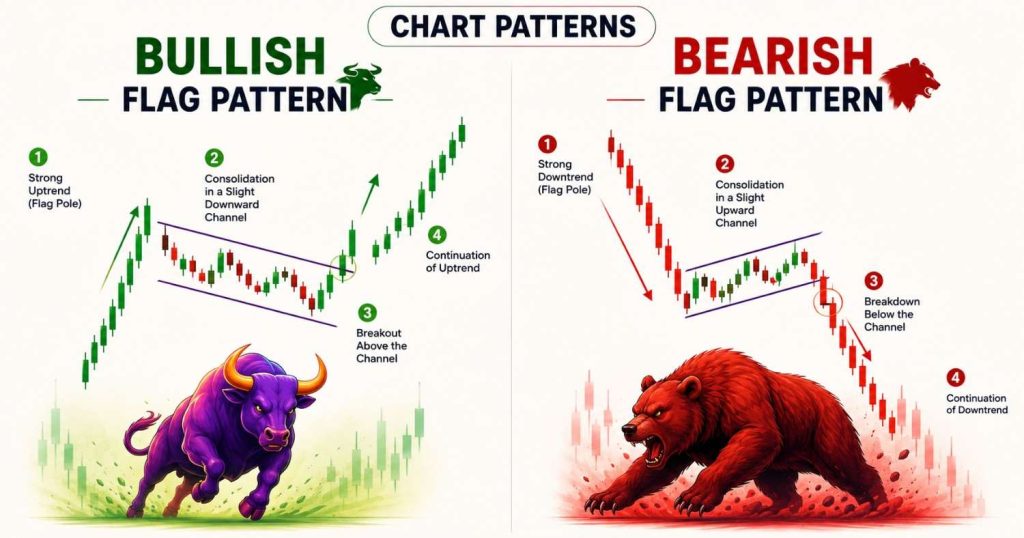
The flag pattern can appear after either a sharp upward or downward price move.
A bullish flag follows a strong upward move. The flag may slope downward as price consolidates before a potential upward breakout.
A bearish flag follows a sharp decline. The flag may slope upward as price consolidates before a potential downward breakout.
The direction of the earlier move helps distinguish bullish and bearish flag formations. However, neither pattern guarantees a particular price movement.
Why does trading volume matter?
Trading volume can provide additional context when traders study the flag and pole pattern. Volume often rises during the pole and may decline as the flag develops.
If volume increases during a breakout, traders may view it as additional confirmation of the price move. However, volume alone cannot confirm that a breakout will continue.
A breakout with lower volume may warrant closer attention to other market signals and conditions. Therefore, traders can use volume as one part of their technical analysis, rather than as a standalone signal.
What are the limits of this chart pattern?
No chart pattern works reliably in every market condition. The flag and pole pattern can produce false signals, and a breakout may fail to continue the earlier trend.
Price can reverse after a breakout, which may result in losses. A deeper retracement can also change how traders interpret the formation.
Therefore, treat this pattern as one part of technical analysis, rather than a standalone decision tool. No chart formation can guarantee a particular future outcome.
You can study charts and practise identifying patterns using the Navia All in One App.
Conclusion
The pole pattern and flag pattern work together as parts of the flag and pole pattern. The pole represents a strong price movement, while the flag shows a period of consolidation. Together, they form a continuation pattern studied in technical analysis. When reviewing the formation, consider the flagpole, flag depth, and trading volume around a potential breakout. No chart pattern guarantees a particular outcome, so risk management remains important.
Key Takeaways
- The pole is a sharp price move in one direction over a relatively short period, and the flag is the consolidation that follows it.
- Together the two parts form the flag and pole pattern, a continuation pattern commonly discussed in technical analysis.
- On a stock chart the flag may resemble a small rectangle that slopes against the preceding move, outlined by two parallel trendlines.
- A measured move adds the flagpole distance to the breakout level for a bullish setup, or subtracts it for a bearish one.
- Volume often rises during the pole and may decline as the flag develops, and an increase on the breakout may be viewed as additional confirmation.
- No chart pattern works reliably in every market condition, so treat the formation as one part of technical analysis rather than a standalone decision tool.
Did you find this article helpful?
Your feedback helps us write better content.

FREQUENTLY ASKED QUESTIONS
Is the pole and flag the same pattern?
No. The pole shows a sharp price movement, while the flag represents a brief pause. Together, they form the flag and pole pattern on a stock chart.
Is the flag pattern bullish or bearish?
It can be either. A bullish flag develops after an upward move, while a bearish flag follows a downward move. Both can indicate possible trend continuation.
How deep can the flag pull back?
A flag with a shallower retracement may better match the typical continuation pattern structure. A deeper retracement can make the formation less typical.
How long does a flag pattern last?
The flag usually represents a relatively brief consolidation period. Its duration can range from several days to several weeks, depending on the chart timeframe.
How do I measure the target after a breakout?
Traders can measure the flagpole and use that distance to estimate a potential move from the breakout level. This remains an estimate, not a guaranteed outcome.
How do traders confirm a breakout?
Traders may examine whether the breakout occurs with increased trading volume. They may also consider whether price closes beyond the flag’s boundaries.
Is the flag and pole pattern reliable?
The formation is widely discussed in technical analysis, but it can fail. Traders should consider trading volume, market conditions, and risk management rather than rely on one chart pattern.
DISCLAIMER: Investment in securities market are subject to market risks, read all the related documents carefully before investing. The securities quoted are exemplary and are not recommendatory. Full disclaimer: https://bit.ly/naviadisclaimer.


