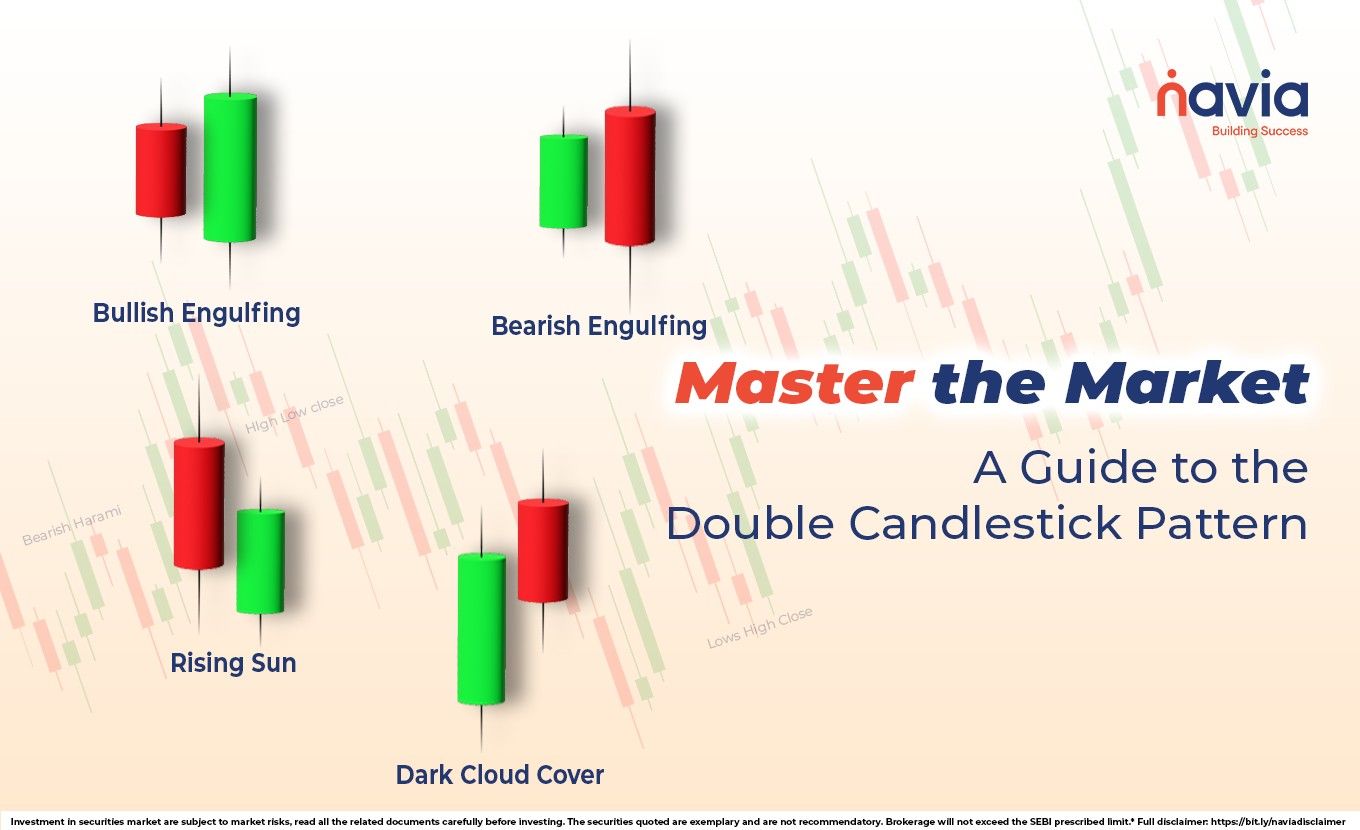
Master the Market: A Guide to the Double Candlestick Pattern
- What is a Double Candlestick Pattern?
- Key Bullish Double Candlestick Patterns
- How to Trade Double Candlestick Patterns Effectively?
- Conclusion
- Frequently Asked Questions
Have you ever felt that a single candlestick signal – like a Hammer or Shooting Star wasn’t quite enough to give you the confidence to enter a trade? While these lone candles offer quick hints, they often lack the decisive evidence needed to confirm a real shift in market momentum. This is where the double candlestick pattern becomes an indispensable tool for technical analysts.
In this guide, we will break down the most influential double candle patterns and show you how to leverage them to build a more robust and accurate trading strategy.
What is a Double Candlestick Pattern?
A double candlestick pattern consists of two consecutive candles that, when viewed together, suggest a potential trend of reversal or continuation. Unlike a single candle, which only shows the sentiment of a specific period, the second candle in a double candle pattern acts as a confirmation of the first.
When these patterns appear at the end of a prolonged uptrend or downtrend, they signal that the current momentum is fading and a new direction is likely to emerge.
Key Bullish Double Candlestick Patterns
When the market is downtrend, traders look for bullish signals to identify a potential bottom. Here are the most common bullish formations:
Engulfing Pattern
An Engulfing Pattern is a powerful two-candle reversal signal that indicates a significant shift in market sentiment. It is classified into two types: Bullish Engulfing (found at the bottom of a downtrend) and Bearish Engulfing (found at the top of an uptrend).
The Formation: The pattern consists of two consecutive candles with contrasting colors:
🔹 Candle 1 (Prior Trend): A small-bodied candle that aligns with the current trend.
In a Bullish Engulfing: This is a small red (bearish) candle.
In a Bearish Engulfing: This is a small green (bullish) candle.
🔹 Candle 2 (Reversal): A much larger candle that completely “engulfs” or overlaps the real body of the first candle.
🔹 In a Bullish Engulfing: A large green candle that opens lower than the first candle’s close and closes higher than its open.
🔹 In a Bearish Engulfing: A large red candle that opens higher than the first candle’s close and closes lower than its open.
The Logic: The logic behind an engulfing pattern is rooted in a sudden and overwhelming change in the tug-of-war between buyers (bulls) and sellers (bears):
🔹 Market Exhaustion: The first small candle suggests that the dominant side (e.g., sellers in a downtrend) is losing momentum. The trend is still in place, but the conviction is fading.
🔹 Decisive Takeover: The second candle represents a total reclaim of control. In a Bullish Engulfing, for example, the price may open lower (showing one last push by sellers), but buyers step in so aggressively that they drive the price far above the previous day’s starting point.
🔹 Psychological Shift: This pattern creates a “liquidity sweep” or a trap for those still following the old trend. The sheer size of the second candle compared to the first indicates that institutional momentum or significant “smart money” has entered the market, making it a high-probability reversal signal.
Piercing Pattern
The Piercing Pattern (also known as the Piercing Line) is a two-candle bullish reversal pattern that typically appears at the bottom of a downtrend. It signals that the selling pressure is exhausting and buyers are beginning to reclaim control.
The Formation: For a valid Piercing Pattern, two specific candles must form in sequence after a clear downward trend:
🔹 Candle 1 (Bearish): A relatively long red (bearish) candle that continues with the existing downtrend. This shows that the bears are still firmly in control.
🔹 Candle 2 (Bullish): A green (bullish) candle that follows immediately. It must meet two strict criteria:
🔹 The Open: It must open with a gap down, meaning it opens below the low (or at least the close) of the previous red candle.
🔹 The Close: It must rally and close above the 50% midpoint of the first red candle’s body.
The Logic: The power of the Piercing Pattern lies in the psychological “trap” it sets for the bears:
🔹 Initial Panic: The gap-down at the start of the second candle suggests that the bearish momentum is accelerating. This often triggers a final wave of selling.
🔹The Rejection: Instead of the price continuing to fall, buyers step in aggressively at these lower levels. The fact that the price manages to “pierce” and close above the halfway point of the previous day’s losses proves that the bulls have effectively countered the bearish dominance.
🔹 Market Sentiment Shift: Because the bulls reclaimed more than half of the territory lost in the previous session, the bears begin to lose confidence and may start covering their short positions, fueling a further upward move.

Dark Cloud Cover Pattern
The Dark Cloud Cover is a powerful two-candle bearish reversal pattern that appears at the end of an uptrend. It serves as a visual warning that the “sunny” optimism of buyers is being overshadowed by a “dark cloud” of selling pressure.
The Formation: For a pattern to be classified as a valid Dark Cloud Cover, it must meet three specific criteria:
🔹 Prior Trend: The pattern must appear after a sustained uptrend or a significant price rise.
🔹 Candle 1 (Bullish): The first day features a strong, large-bodied green (bullish) candle, confirming that buyers are still in control.
🔹 Candle 2 (Bearish): The second day begins with a gap (the price opens above the previous day’s high or close).
However, the price then reverses and drops sharply.
🔹 The Critical Rule: The bearish candle must close below the midpoint (50%) of the first candle’s body, but not necessarily below its open (which would make it a Bearish Engulfing).
The Logic: The effectiveness of this pattern lies in the psychological shift it represents between the two sessions:
🔹 The Trap: The second day gap initially suggests that the bullish momentum is continuing. This often traps late-entry buyers who buy at the peak.
🔹The Rejection: When the price fails to stay at those highs and falls deep into the previous day’s gains, it signals that supply has overwhelmed demand.
🔹 Loss of Confidence: Closing below the 50% mark of the bullish candle is a mathematical sign that more than half of the previous day buyers are now sitting on a loss. This often triggers a chain reaction of profit-taking and panic selling, leading to a trend of reversal.
Tweezer Pattern
A Tweezer Pattern is a two-candle reversal formation that signals the market has hit a “wall” it cannot break. It gets its name from the way the two matching highs or lows look like the pincers of a pair of tweezers.
The pattern is divided into two types: the Tweezer Top (bearish reversal) and the Tweezer Bottom (bullish reversal).
🔹 Tweezer Top (Bearish Reversal)
This pattern appears at the peak of an uptrend, signaling that buyers have exhausted their momentum.
The Formation: Prior Trend: Must occur after a clear uptrend.
Candle 1: A bullish (green) candle that continues the trend.
Candle 2: A bearish (red) candle that opens near the previous close but fails to break higher.
Key Feature: Both candles share an identical or nearly identical high.
The Logic: The matching highs create a temporary but strong resistance level. It shows that while buyers were confident on the first day, they were unable to push the price even a fraction higher on the second day. This “double rejection” suggests that sellers are stepping in and a downward move is likely.
🔹 Tweezer Bottom (Bullish Reversal)
This pattern forms at the base of a downtrend, signaling that sellers have lost control.
The Formation: Prior Trend: Must occur after a clear downtrend.
Candle 1: A bearish (red) candle that follows the downward momentum.
Candle 2: A bullish (green) candle that opens near the previous close but refuses to go lower.
Key Feature: Both candles share an identical or nearly identical low.
The Logic: The matching lows indicate a strong support level. It reflects a “rejection of lower prices.” Sellers tried twice to push the market down but were stopped at exactly the same point both times. This indicates that the supply has been absorbed by buyers, making a bullish reversal probable.
Bearish Kicker
The Bearish Kicker is one of the most powerful and high-conviction two-candle reversal signals in technical analysis. Unlike patterns that show a gradual shift in power, the Kicker represents a “violent” and instantaneous takeover by sellers.
The Formation: The Bearish Kicker unfolds over two sessions and must meet these strict criteria to be valid:
🔹 First Candle: A strong bullish (green/white) candle appears during an ongoing uptrend. It often has a large body with little to no shadows (a Marubozu), suggesting the bulls are in full control.
🔹 The “Kick” (Gap Down): The second candle opens with a massive gap down. Crucially, it must open at or below the opening price of the previous day’s bullish candle.
🔹 Second Candle: A large bearish (red/black) candle that moves further downward, closing well below its open. Like the first candle, it ideally has very small or no shadows, indicating absolute selling pressure.
The Logic: The logic behind this pattern is rooted in a sudden, dramatic shift in market psychology, often triggered by surprise news or a major institutional sell-off.
🔹 Sudden Capitulation: The massive gap down completely ignores the previous day’s gains, leaving retail “long” investors trapped in losing positions instantly.
🔹 Absolute Sentiment Flip: While a “Bearish Engulfing” pattern shows sellers slowly overcoming buyers during a session, the Kicker shows that buyers have no defense left. The sentiment flips from extreme optimism to total panic before the market even opens for the second day.
🔹 Institutional Hand: Because of the sheer volume required to gap a price down so significantly, the Bearish Kicker is viewed as a clear sign of institutional distribution (smart money exiting and shorting).
How to Trade Double Candlestick Patterns Effectively?
Simply spotting a double candle pattern isn’t enough; you need a system. Follow these steps inspired by professional technical analysis (education purpose only):
🔸 Identify the Trend: Double candlestick patterns are most effective when they appear after a sustained move. A Bullish Engulfing is meaningless in a sideways market; it only carries weight after a significant downtrend.
🔸 Check for Volume: Validation from volume is crucial. If a Bullish Engulfing pattern occurs with high trading volume, the signal is much stronger than one with low volume.
🔸 Wait for the Third Candle: While the double candlestick pattern provides the signal, many conservative traders wait for the third candle to break the high (or low) of the pattern before entering the trade.
🔸 Combine with Indicators: Enhance your accuracy by combining these patterns with tools like the Relative Strength Index (RSI) or Moving Averages. For instance, a Piercing Pattern forming exactly on the 200-day Moving Average is a high-probability trade.
Conclusion
Mastering the double candlestick pattern is a major milestone for any trader. By moving beyond single-candle analysis, you allow the market to provide more evidence before you commit to your capital. Whether it is the aggressive shift of an Engulfing candle or the subtle exhaustion of a Harami, every double candle pattern provides a window into the collective psychology of the market.
Remember, no pattern is 100% accurate. By combining your own chart of observations, you can navigate the complexities of the stock market with greater confidence.
Do You Find This Interesting?
We’d Love to Hear from you-

Frequently Asked Questions
What is a double candlestick pattern?
A double candlestick pattern is a technical formation consisting of two adjacent candles on a price chart, used to forecast whether a trend will continue or reverse. Also known as dual-candle or two-bar patterns, they offer higher reliability than single-candle signals because the second candle provides essential validation or “confirmation” of the first.
Is a double top pattern bullish or bearish?
A double top is a bearish technical reversal pattern that resembles the letter “M”. It signals a potential trend change after an asset hits a resistance level twice but fails to break through, indicating that the preceding uptrend is losing momentum, and a shift toward a downtrend may be imminent.
What is the strongest bullish pattern?
While no individual signal provides a guarantee, the Bullish Engulfing, Morning Star, and Three White Soldiers are widely regarded as the most potent bullish reversal patterns.
Do I buy when bullish or bearish?
Market participants continue to navigate the distinct impacts of optimism and caution. A bullish environment typically fuels investor confidence, prompting aggressive buying and driving asset valuations higher through a self-reinforcing cycle of demand.
DISCLAIMER: Investments in the securities market are subject to market risks, read all the related documents carefully before investing. The securities quoted are exemplary and are not recommendatory. Brokerage will not exceed the SEBI prescribed limit.