


Mastering the Relative Strength Index (RSI): A Guide for Beginners
- Introduction
- What Is the RSI?
- How to Use the RSI
- 1. Overbought and Oversold Levels
- 2. RSI Divergence
- 3. RSI with Trend Analysis
- Example Scenarios
- Common Settings for RSI
- 1. Period
- 2. Overbought Level
- 3. Oversold Level
- 4. Adjustments for Short-Term Trading
- 5. Adjustments for Long-Term Investing
- Best Practices for Using RSI
- RSI Strategy in Action
- Example 1: Buying a Stock at Oversold Levels
- Example 2: Avoiding Overbought Stocks
- Key Tips for Beginners
- Conclusion
- Key Takeaways
- Frequently Asked Questions
💡 Quick Answer
The Relative Strength Index (RSI) is a momentum oscillator that moves between 0 and 100, measuring the speed and change of price movements. An RSI above 70 suggests a stock may be overbought and due for a correction; below 30 suggests it may be oversold and due for a rebound.
Introduction
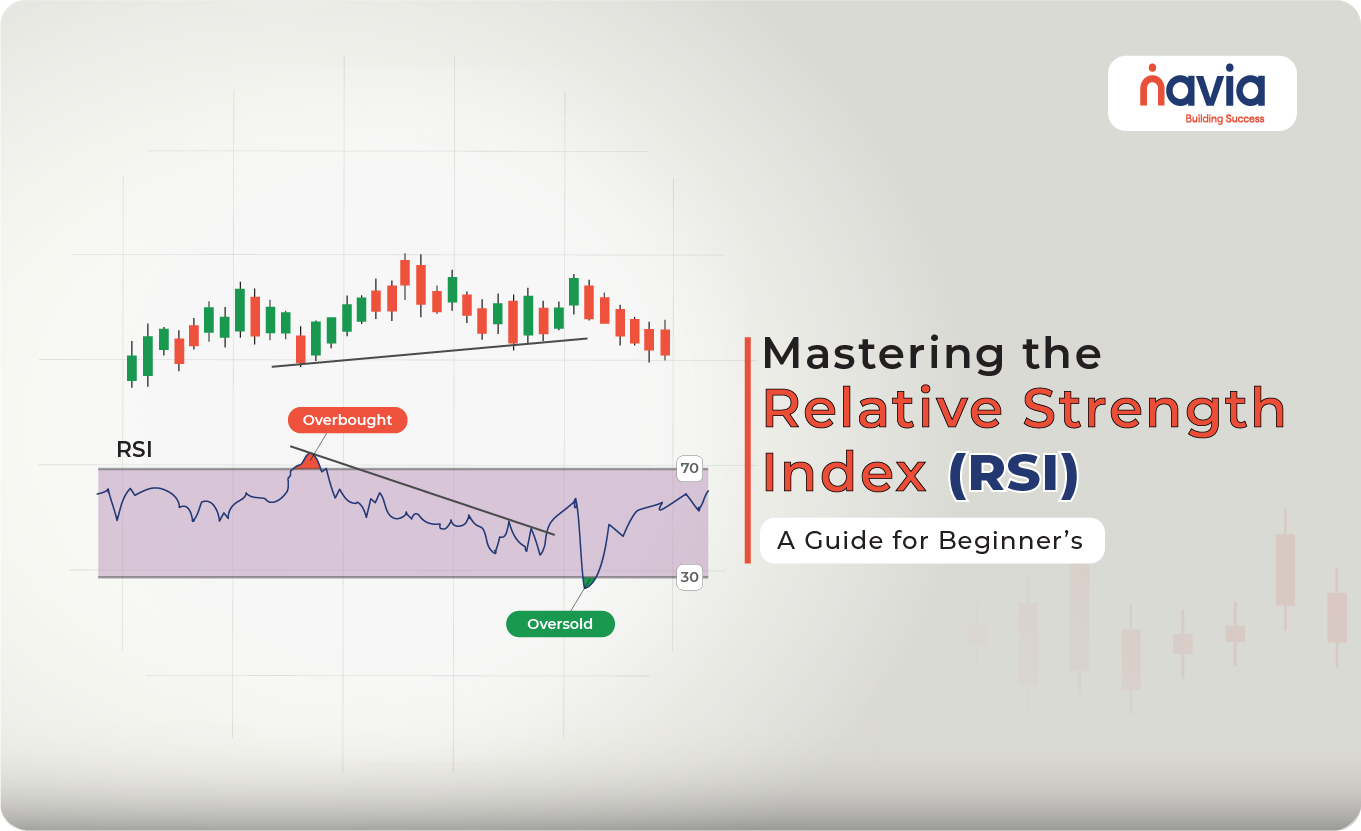
The Relative Strength Index (RSI) is one of the most popular and easy-to-use indicators in technical analysis. Developed by J. Welles Wilder, RSI measures the speed and change of price movements to identify overbought and oversold conditions in the market. For new traders and investors, RSI is an excellent tool to enhance decision-making. This guide will explain RSI in simple terms, provide examples, and share the most common settings.
What Is the RSI?
The RSI is a momentum oscillator that moves between 0 and 100. It is used to:
- Identify Overbought Conditions: When RSI is above 70, the asset may be overbought and due for a correction.
- Identify Oversold Conditions: When RSI is below 30, the asset may be oversold and due for a rebound.
How to Use the RSI
1. Overbought and Oversold Levels
- Above 70: Overbought (potential sell signal).
- Below 30: Oversold (potential buy signal).
Example:
If a stock’s RSI rises above 70, it may indicate the stock is overbought. Conversely, if it falls below 30, it may signal that the stock is oversold and likely to bounce back.
2. RSI Divergence
- Bullish Divergence: When the price makes a lower low, but RSI makes a higher low, it signals a potential reversal to the upside.
- Bearish Divergence: When the price makes a higher high, but RSI makes a lower high, it signals a potential reversal to the downside.
Example:
If a stock’s price drops to ₹100 (lower low), but the RSI rises from 25 to 30 (higher low), this bullish divergence may indicate the price is about to rise.
3. RSI with Trend Analysis
In a strong trend:
- RSI may stay above 30 and hover near 70 in an uptrend.
- RSI may stay below 70 and hover near 30 in a downtrend.
Example:
If a stock in an uptrend shows RSI bouncing near 40 (above the oversold zone), it may indicate a buying opportunity within the trend.
Example Scenarios
| Scenario | RSI Level | Signal | Trading Insight |
| Overbought Conditions | RSI > 70 | Asset may be overbought, watch for reversal. | Consider selling or taking profits. |
| Oversold Conditions | RSI < 30 | Asset may be oversold, watch for reversal. | Consider buying or entering a position. |
| Bullish Divergence | RSI rises as price falls | Potential upward reversal. | Look for a buying opportunity. |
| Bearish Divergence | RSI falls as price rises | Potential downward reversal. | Look for a selling opportunity. |
| RSI in Uptrend | RSI stays near 70 | Indicates strong momentum. | Consider holding or adding to long positions. |
| RSI in Downtrend | RSI stays near 30 | Indicates weak momentum. | Consider avoiding or shorting the asset. |
Common Settings for RSI
The default and most commonly used settings for RSI are:
1. Period
- 14 periods (default)
This calculates RSI based on the last 14 candles (e.g., days, hours, or minutes depending on the chart).
2. Overbought Level:
- 70
This signals potential overbought conditions.
3. Oversold Level:
- 30
This signals potential oversold conditions.
4. Adjustments for Short-Term Trading:
- Use 9 periods for faster signals in intraday or swing trading.
5. Adjustments for Long-Term Investing:
- Use 20 or 25 periods to reduce noise and focus on bigger trends.
Best Practices for Using RSI
1. Combine with Other Indicators: Use RSI alongside moving averages, Bollinger Bands, or MACD for confirmation.
2. Avoid Using RSI Alone: It works best when combined with price action analysis or support/resistance levels.
3. Adjust Periods for Your Style: Shorter periods are better for active traders, while longer periods suit investors.

RSI Strategy in Action
Example 1: Buying a Stock at Oversold Levels
- Scenario: A stock’s price falls to ₹90, and its RSI drops to 25.
- Action: Consider buying as RSI signals the stock is oversold.
- Outcome: The price rebounds to ₹100, validating the RSI signal.
Example 2: Avoiding Overbought Stocks
- Scenario: A stock rises to ₹200, and its RSI hits 75.
- Action: Avoid buying as RSI signals the stock is overbought.
- Outcome: The price corrects to ₹180, confirming the RSI warning.
Key Tips for Beginners
1. Start with Default Settings: Use the 14-period RSI and 70/30 levels initially.
2. Practice with Historical Data: Backtest RSI signals on charts to see how it works in different market conditions.
3. Use RSI with Caution in Strong Trends: RSI can stay overbought or oversold for extended periods during strong trends.
Conclusion
The Relative Strength Index is a versatile and beginner-friendly tool that helps traders identify overbought and oversold conditions, spot divergences, and analyze momentum. By combining RSI with other indicators and practicing proper risk management, you can make more informed trading decisions.
Start by applying the default 14-period RSI on your charts, observe its behavior, and gradually refine your strategy as you gain confidence.
Happy Trading!
Key Takeaways
- RSI is a momentum oscillator that moves between 0 and 100, developed by J. Welles Wilder.
- Above 70 signals overbought conditions; below 30 signals oversold conditions.
- Bullish divergence is a lower low in price against a higher low in RSI; bearish divergence is the reverse.
- The default setting is 14 periods — use 9 periods for faster intraday signals, 20 or 25 to reduce noise.
- RSI can stay overbought or oversold for long stretches in a strong trend, so confirm with other tools.
Related guides: Stochastic RSI crossovers · Bollinger Bands · Money Flow Index (MFI)
Frequently Asked Questions
What is the Relative Strength Index (RSI)?
The Relative Strength Index (RSI) is a momentum oscillator that moves between 0 and 100. Developed by J. Welles Wilder, it measures the speed and change of price movements to identify overbought and oversold conditions in the market.
What RSI level is considered overbought or oversold?
When RSI is above 70, the asset may be overbought and due for a correction. When RSI is below 30, the asset may be oversold and due for a rebound.
What is the best RSI setting for beginners?
The default and most commonly used setting is 14 periods, which calculates RSI based on the last 14 candles. Start with the 14-period RSI and the 70/30 levels, then adjust as you gain confidence.
What is RSI divergence?
Bullish divergence occurs when the price makes a lower low but RSI makes a higher low, signalling a potential reversal to the upside. Bearish divergence occurs when the price makes a higher high but RSI makes a lower high, signalling a potential reversal to the downside.
Can RSI be used on its own?
It works best when combined with price action analysis or support and resistance levels. Use RSI alongside moving averages, Bollinger Bands, or MACD for confirmation, because RSI can stay overbought or oversold for extended periods during strong trends.
Do You Find This Interesting?
We’d Love to Hear from you-

DISCLAIMER: Investments in the securities market are subject to market risks, read all the related documents carefully before investing. The securities quoted are exemplary and are not recommendatory. Brokerage will not exceed the SEBI prescribed limit.
Full disclaimer: https://bit.ly/naviadisclaimer


