


Using Bollinger Bands for Decision making
- Introduction
- What Are Bollinger Bands?
- How to Read Bollinger Bands
- How to Use Bollinger Bands
- 1. Identify Overbought and Oversold Conditions
- 2. Spot Breakouts
- 3. Use the Squeeze for Potential Trades
- 4. Combine with Other Indicators
- Examples in Tabular Format
- Common Mistakes to Avoid
- Key Tips for Beginners
- Conclusion
- Key Takeaways
- Frequently Asked Questions
💡 Quick Answer
Bollinger Bands are three lines on a price chart: a middle 20-day simple moving average, an upper band two standard deviations above it, and a lower band two below. They expand in high volatility and contract in low volatility, helping traders spot overbought, oversold and breakout conditions.
Introduction
Bollinger Bands are one of the most popular tools in technical analysis, developed by John Bollinger in the 1980s. These bands help traders and investors understand market volatility and identify potential entry and exit points. If you’re new to trading or investing, this guide will explain Bollinger Bands in a simple and practical way with examples to get you started.
What Are Bollinger Bands?
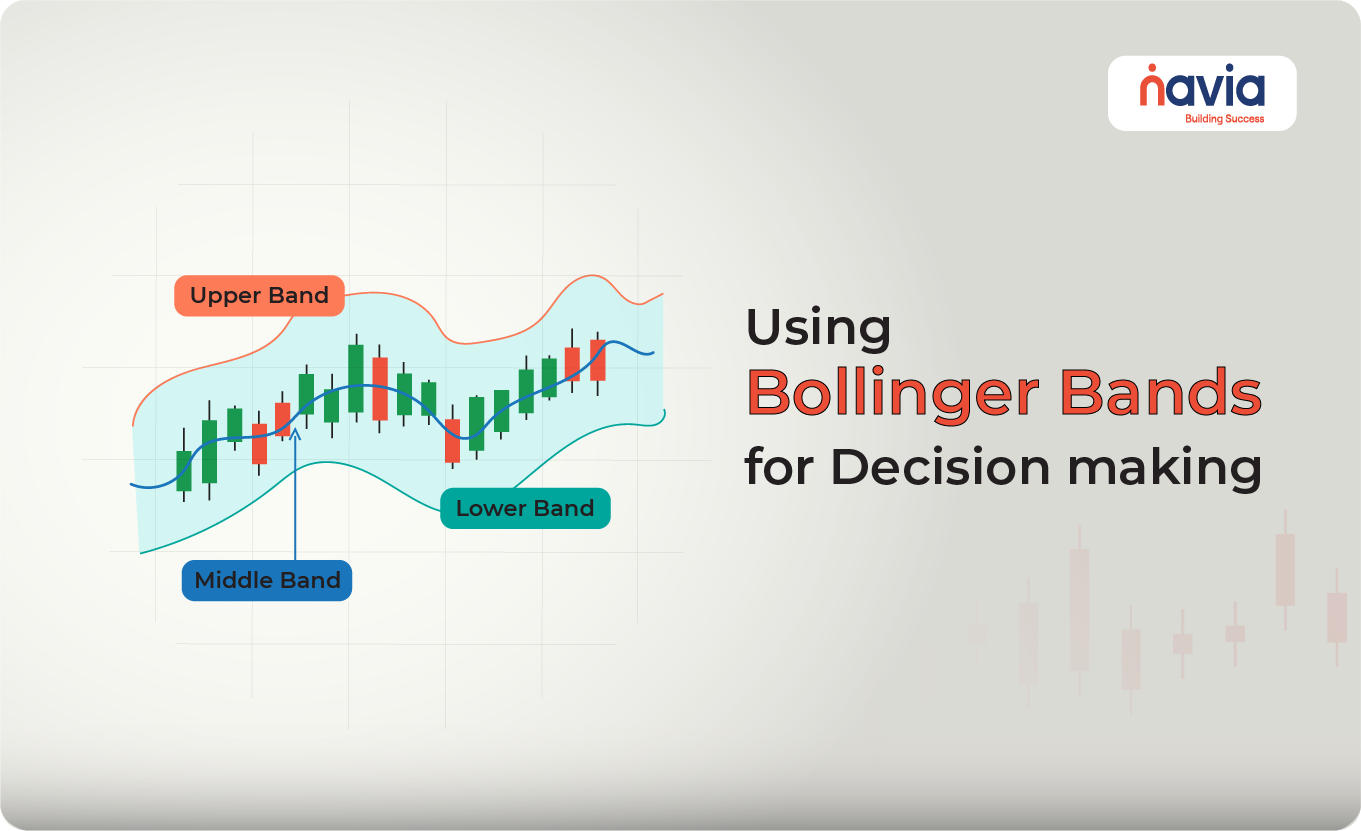
Bollinger Bands consist of three lines plotted on a price chart:
1. Middle Band (Moving Average): This is usually a 20-day simple moving average (SMA) of the price.
2. Upper Band: This is the middle band plus two standard deviations of price.
3. Lower Band: This is the middle band minus two standard deviations of price.
These bands expand and contract based on market volatility:
- Expand during high volatility.
- Contract during low volatility.
How to Read Bollinger Bands
1. Price Near Upper Band: The asset may be overbought (potential for a pullback or correction).
2. Price Near Lower Band: The asset may be oversold (potential for a bounce or recovery).
3. Squeeze: When the bands contract significantly, it signals reduced volatility, often preceding a breakout.
4. Breakout: Price moves outside the bands. This is not a trading signal but indicates strong momentum.
How to Use Bollinger Bands
1. Identify Overbought and Oversold Conditions
When the price touches or exceeds the upper band, it may indicate the asset is overbought. Similarly, touching or falling below the lower band may indicate oversold conditions.
Example:
A stock priced at ₹100 trades at its upper Bollinger Band at ₹110. This suggests a possible reversal or consolidation as the stock might be overbought.
2. Spot Breakouts
Bollinger Bands do not predict the direction of a breakout but help identify when one might occur. If the price moves outside the bands, it signals strong momentum.
Example:
If a stock trading at ₹200 breaks above its upper band at ₹210 with high volume, it may signal the start of a bullish trend.
3. Use the Squeeze for Potential Trades
The “Bollinger Band Squeeze” occurs when the bands contract due to low volatility. This usually precedes a significant price move.
Example:
If a stock’s price consolidates between ₹150 and ₹155 for several days with narrowing bands, prepare for a breakout or breakdown. A breakout above ₹155 may signal a buy opportunity, while a breakdown below ₹150 may signal a sell.
4. Combine with Other Indicators
Bollinger Bands work best when combined with other tools like RSI (Relative Strength Index) or MACD (Moving Average Convergence Divergence).
Example:
If the price touches the lower band and the RSI indicates the stock is oversold (RSI below 30), it strengthens the case for a potential bounce.
Examples in Tabular Format
| Scenario | Price Action | Bollinger Band Signal | Trading Insight |
| Overbought Condition | Price touches or exceeds upper band. | Overbought | Possible reversal; consider selling or shorting. |
| Oversold Condition | Price touches or falls below lower band. | Oversold | Possible bounce; consider buying. |
| Bollinger Band Squeeze | Bands narrow significantly. | Low volatility, breakout imminent | Watch for a breakout direction. |
| Breakout Above Upper Band | Price closes above upper band. | Strong bullish momentum | Consider entering a long position. |
| Breakdown Below Lower Band | Price closes below lower band. | Strong bearish momentum | Consider entering a short position. |

Common Mistakes to Avoid
1. Assuming Bands Always Mean Reversal: Prices can “ride the band” during strong trends.
2. Ignoring Volume: Breakouts without volume confirmation may fail.
3. Relying Solely on Bollinger Bands: Use other indicators to confirm signals.
Key Tips for Beginners
1. Start with Default Settings: Use the standard 20-day period and 2 standard deviations.
2. Practice on a Demo Account: Test Bollinger Band strategies before using real money.
3. Focus on Context: Combine Bollinger Bands with market context, such as news or earnings announcements.
Conclusion
Bollinger Bands are a versatile tool that can help traders spot opportunities and manage risks. By understanding how to interpret overbought/oversold conditions, breakouts, and squeezes, you can enhance your trading strategy. Remember, no indicator is foolproof—always combine Bollinger Bands with other tools and sound risk management practices.
Happy trading!
Key Takeaways
- Bollinger Bands are a middle 20-day SMA with upper and lower bands two standard deviations away.
- The bands expand during high volatility and contract during low volatility.
- Price near the upper band may be overbought; near the lower band it may be oversold.
- A squeeze — bands contracting sharply — often precedes a significant price move.
- Prices can ride the band in a strong trend, so a band touch alone is not a reversal signal.
Related guides: Stochastic RSI crossovers · Moving averages · Money Flow Index (MFI)
Frequently Asked Questions
What are Bollinger Bands?
Bollinger Bands consist of three lines plotted on a price chart: a middle band that is usually a 20-day simple moving average (SMA) of the price, an upper band set two standard deviations above it, and a lower band set two standard deviations below it. They were developed by John Bollinger in the 1980s.
What does a Bollinger Band squeeze mean?
A Bollinger Band Squeeze occurs when the bands contract due to low volatility. This signals reduced volatility and usually precedes a significant price move or breakout.
What are the default Bollinger Band settings?
The standard settings are a 20-day period and 2 standard deviations. Beginners should start with these defaults before experimenting.
Does price touching the upper Bollinger Band mean it is time to sell?
Not necessarily. Price touching or exceeding the upper band may indicate the asset is overbought, but prices can ride the band during strong trends, so a touch on its own is not a reversal signal.
Should Bollinger Bands be combined with other indicators?
Yes. Bollinger Bands work best when combined with other tools like RSI (Relative Strength Index) or MACD (Moving Average Convergence Divergence). If the price touches the lower band and RSI indicates the stock is oversold, it strengthens the case for a potential bounce.
Did you find this article helpful?
Your feedback helps us write better content.
DISCLAIMER: Investments in the securities market are subject to market risks, read all the related documents carefully before investing. The securities quoted are exemplary and are not recommendatory. Brokerage will not exceed the SEBI prescribed limit.
Full disclaimer: https://bit.ly/naviadisclaimer


