


Analyzing Pattern Overview: Guide to the Tweezer Bottom Pattern
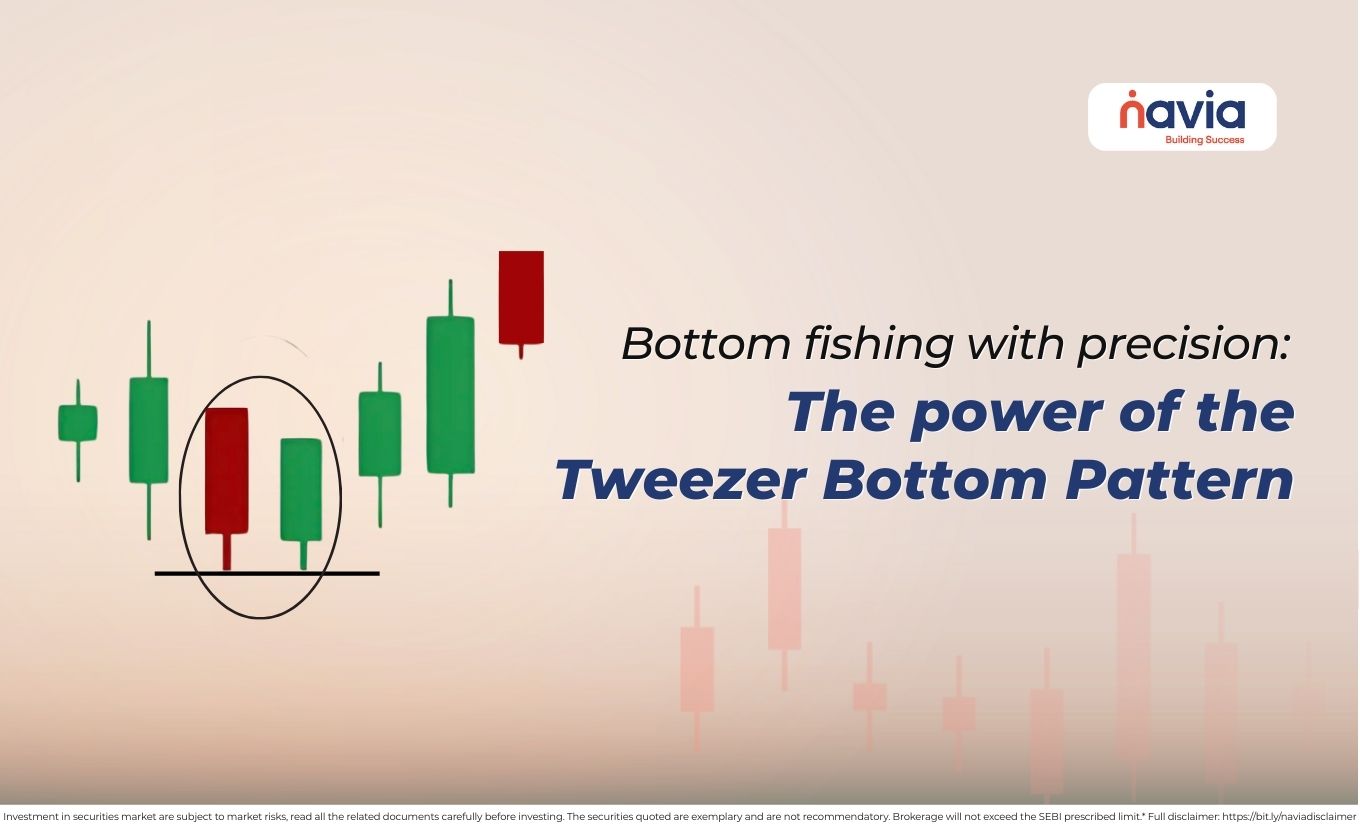
In the volatile landscape of the 2026 stock market, observing periods of slowing downward momentum is the widely discussed concept for swing traders and long-term investors alike. While many traders fear “falling knives,” some market participants look for specific structural signals that indicate a price floor has been established. One of the commonly referenced and visually striking signals for this is the tweezer bottom.
When the market hits a level, it simply refuses to break below; it leaves a footprint. Understanding the tweezer bottom candlestick pattern allows you to read that footprint and observe possible upward price movement.
💡 Quick Answer
A tweezer bottom is a bullish reversal candlestick pattern that forms at the end of a downtrend, where two or more candles share almost the same low. Those matching lows show that sellers were rejected at a support level, signalling that downward momentum is fading and prices may begin to rise.
What is a Tweezer Bottom?
A tweezer bottom is a two-candle pattern associated with upward price movement that appears at the end of a downtrend. It is characterized by two or more candlesticks that have the exact same (or very nearly the same) low point.
The name is derived from the visual similarity to a pair of tweezers; the two matching lows act as the “tips” that pinch the price and prevent it from falling further. In technical terms, it represents a repeated buying activity near a support level.
For a formation to be classified as a valid tweezer bottom candle pattern, it must follow these four rules:
- The Context: It must occur after a clear and sustained downtrend.
- First Candle: A bearish candle that continues the downward move.
- Second Candle: A bullish candle (usually) that hits the same low as the first candle but fails to break below it, eventually closing higher.
- The Lows: The “shadows” or “wicks” of both candles must hit the same price floor.
What Does a Tweezer Bottom Candle Look Like?
The candlestick tweezer bottom can manifest in several ways, each carrying a slightly different weight of conviction:
| The Standard Tweezers | A long red candle followed by a long green candle with identical lows. This shows a strong reaction near lower price levels and an immediate takeover by buyers. |
| Wick-to-Wick Tweezers | The bodies of the candles may be small, but the long lower wicks touch the same price point. This indicates that intraday attempts to push the price lower were met with increased buying activity. |
| The Hammer Tweezer | Often, the second candle in a tweezer bottom pattern is a “Hammer” candlestick. When a Hammer’s low matches the previous day’s low, the pattern may attract additional market attention. |
Psychology: Why Does It Work?
To master the tweezer bottom candlestick pattern, you must look beyond the colors and understand the emotional shift in the market. On the first day of the pattern, the selling activity is dominant. They push the price to a fresh low, and market sentiment remains weak. However, by the end of the session, the selling slow down.
On the second day, the bears attempt to “break the floor” once more. They push the price back down to the previous day’s low, expecting a breakdown. Instead, they hit an increased buying activity. Buyers-often some market participants recognize the value at this price level and start accumulating. When the bears realize the price won’t break, they begin to cover their short positions, contributing to upward price movement to close significantly higher.
The matching lows signify that the bears have continued selling attempts at the support level and failed.

Strategic Trading: Observing the Tweezer Bottom Pattern
Simply spotting a tweezer bottom pattern isn’t enough; you need a disciplined educational analysis approach to thrive in 2026’s fast-moving markets. Let’s see some of the strategies (educational purpose only).
| Confirm the Location | A tweezer bottom in the middle of a trading range is often just “noise.” Look for this pattern at: Major historical support levels. The lower boundary of a Bollinger Band. Key Fibonacci retracement levels (like the 61.8% mark). |
| Wait for the Close | Never enter a trade while the second tweezer bottom candle is still forming. Wait for the candle to close to ensure the lows actually match, and the price hasn’t “leaked” lower. |
| The Entry Point | Certain analysts monitor movement above when the price moves above the high of the second candle in the pattern. This confirms that the upward price movement continues. |
| Risk Reference Levels | The tweezer bottom offers one of the most logical stop-loss placements in all technical analysis. Some traders monitor levels just a few pips below the matching lows. If the price breaks at that level, the “floor” has failed, and you should exit the trade immediately. |
Tweezer Bottom vs. Other Reversals
| Pattern | No. of Candles | Key Visual Feature | Psychological Signal | Relative Reliability |
|---|---|---|---|---|
| Tweezer Bottom | 2 | Matching Lows (Wicks or Bodies) | Immediate rejection of a specific support price | Moderate (Needs confirmation) |
| Bullish Engulfing | 2 | The 2nd candle body completely covers the 1st. | Strong upward movement; buying activity exceeded selling activity | High |
| Hammer | 1 | Small body with a very long lower wick | Buyers pushed the price back up significantly within one session | Moderate |
| Morning Star | 3 | 3Big Red ➜ Tiny “Star” ➜ Big Green | Slow transition from fear to indecision to hope | Very High |
| Bullish Harami | 2 | 2nd small candle sits inside the 1st large candle | Selling momentum has suddenly stalled (like a “pause”) | Low (Signal of caution) |
| Double Bottom | Many | Two distinct price troughs with a peak in between | Long-term tug-of-war where a floor is tested over weeks | Excellent |
Bottom Line
The tweezer bottom is a simple yet profound signal of slowing market momentum. It tells you that for two consecutive periods, the market looked into the abyss and decided the buying activity increased near those levels. By incorporating the tweezer bottom candlestick pattern into your 2026 trading toolkit, you gain a clear, objective way to identify market floors and monitor price movement more systematically.
Respect the floor, watch the volume, and let the tweezers point the way to the future market movement.
The tweezer bottom is the bullish mirror image of the tweezer top pattern, which caps an uptrend. To round out your reversal toolkit, study other bullish setups such as the three inside up, three outside up, and bullish kicker patterns.
Do You Find This Interesting?
We’d Love to Hear from you-

Key Takeaways
- A tweezer bottom is a two-candle bullish reversal pattern defined by two matching lows at the end of a downtrend.
- It shows that sellers repeatedly failed to push below a support level, hinting the downtrend may be ending.
- Reliability rises on Daily and Weekly charts; intraday tweezers are far more prone to false signals.
- Confirm it with a close above the second candle’s high, a volume spike, and support or oversold-RSI context.
- The matching lows give a clean stop-loss reference — exit if price decisively breaks below that floor.
- It is the bullish mirror image of the tweezer top, which forms at the end of an uptrend.
Frequently Asked Questions
What is a tweezer bottom candlestick?
A tweezer bottom is a two-candle bullish reversal pattern that appears at the end of a downtrend. It is named because the two candles have matching (or nearly identical) lows, resembling the tips of a pair of tweezers.
Is tweezer Bottom bullish?
Yes. It is a pattern associated with upward price movement. It indicates that the selling pressure has been exhausted at a specific price level. When the second candle refuses to break the first candle’s low, it shows that buyers are showing buying activity near support that “floor” and are ready to push the price back up.
How do you confirm a tweezer bottom?
Relying on just the two candles can lead to temporary formations. To confirm the pattern, traders look for:
🔹Context: The pattern must appear after a clear downtrend (not in a sideways market).
🔹The Third Candle: Wait for the next candle to close above the high of the second (bullish) candle.
🔹Volume: A spike in trading volume on the second candle proves that big institutional “buyers” are entering the market at that level.
🔹Support Zones: It is often monitored more closely if it forms at a major historical support level or an oversold RSI level.
What timeframes are best for tweezer bottoms?
The reliability of the signal increases with the timeframe:
➢ Daily and Weekly (Best): These are the most dependable for long-term trend reversals as they represent the collective sentiment of major banks and funds.
➢ 1-Hour and 4-Hour (Good): Effective for swing traders looking for medium-term moves.
➢ Intraday (1-min to 15-min): These often produce “false tweezers” due to market noise and are considered much less reliable unless they align with a higher timeframe support.
What happens after tweezer bottom?
Once a tweezer bottom is confirmed, the following typically occurs:
▶ Upward Price Movement: The previous downward momentum stops, and the price begins to trend upward.
▶ New Support Level: The matching lows of the tweezers often become a “hard” support level for the future.
▶ Short Covering: Traders who were “shorting” the stock often rush to buy back their positions (cover), which adds additional buying activity.
Did you find this article helpful?
Your feedback helps us write better content.

DISCLAIMER: Investment in securities market are subject to market risks, read all the related documents carefully before investing. The securities quoted are exemplary and are not recommendatory. Full disclaimer: https://bit.ly/naviadisclaimer.


