


Turning the Tide: Mastering the Inverted Hammer Pattern for Bullish Reversals
In stock trading, the “perfect entry” is a mix of patience and pattern recognition. Among the hundreds of visual cues available on a price chart, few are as distinct or as potentially lucrative as the inverted hammer pattern. When a market continuously stays in long-term decline, traders look for signs of exhaustion—the moment when the “bears” lose their grip, and the “bulls” prepare for a comeback.
Like the name suggests, the inverted hammer is like a tool designed to strike the market floor and bounce back up. This blog will help you understand what an inverted hammer means, how to identify it, and how to use it in your trading journey.
💡 Quick Answer
The inverted hammer is a single-candle bullish reversal that forms at the bottom of a downtrend. It has a small body, a long upper shadow at least twice the body, and little lower shadow — a sign that buyers are starting to challenge the sellers. Wait for the next candle to confirm.
What is an Inverted Hammer Pattern?
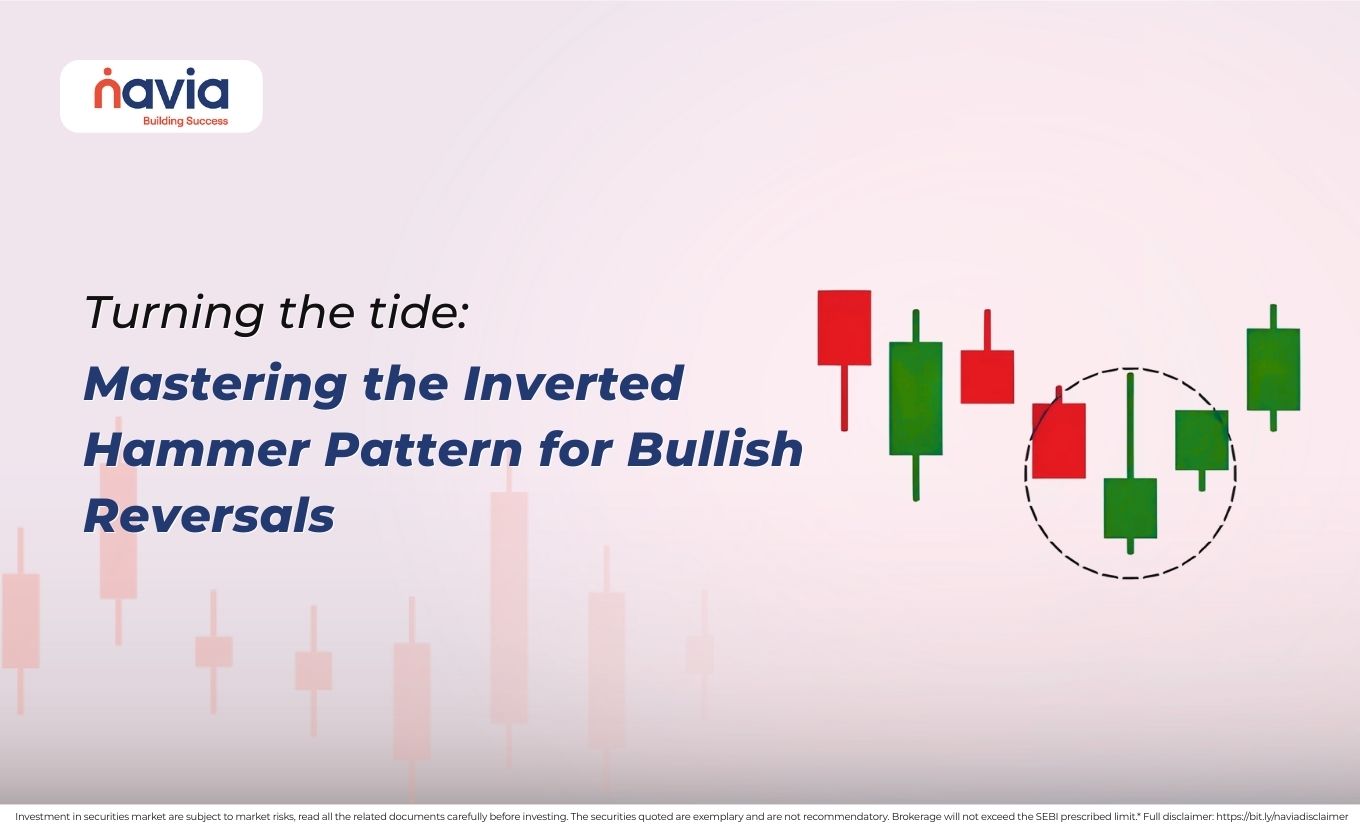
The inverted hammer pattern is a single-candlestick pattern that appears at the bottom of a downtrend. It is considered a bullish reversal pattern; which means it warns the current downtrend slide might be ending, and an upward move is about to begin.
You can easily recognize it visually, let’s see the major features of it;
- A Small Real Body: Difference between the open and close is narrow.
- A Long Upper Shadow: This “wick” is typically at least twice the height of the real body.
- Little to No Lower Shadow: The price rarely dips much lower than the opening or closing price.
How to Identify an Inverted Hammer Candle Pattern?
Like any other pattern, not every “upside-down hammer” is a tradeable signal. To find inverted hammer candle pattern, look for these four specific criteria:
| The Preceding Trend | The pattern is only valid if it occurs after a sustained downtrend. If you see this shape in a sideways market, it is often just “market noise.” The more “oversold” the stock is, the more powerful the reversal usually becomes. |
| The Upper Shadow Ratio | The upper wick must be at least two times the length of the body. If the wick is short, it shows that buyers didn’t have enough strength to truly challenge the sellers. A long wick indicates a violent rejection of lower prices. |
| Color Matters (But Not Always) | An inverted hammer can be green (bullish) or red (bearish). Green: Means the close is higher than the open, considered a strong signal. Red: Close is lower than the open. While still bullish in context, it shows slightly less conviction. |
| Volume Confirmation | A valid inverted hammer pattern should ideally be accompanied by a spike in volume. This proves that it wasn’t just a few retail traders buying, but rather institutional players stepping in. |

Inverted Hammer vs. Shooting Star: Don’t Get Confused!
The most common mistake beginners make is confusing the inverted hammer with the shooting star. Some of the major confusing points are given below;
| Feature | Inverted Hammer | Shooting Star |
| Trend Context | Appears at the bottom of a downtrend | Appears at the top of an uptrend |
| Signal | Bullish Reversal (Buy) | Bearish Reversal (Sell) |
| Psychology | Buyers are testing a “bottom” | Buyers are exhausted at the “top” |
| Confirmation | Next candle must close above its high | Next candle must close below its low |
| Action | Potential “Buy” or “Long” signal | Potential “Sell” or “Short” signal |
| Stop-Loss | Place just below the candle body/wick. | Placed just above the long upper wick. |
| Failure Sign | A break below the low of the pattern. | A break above the high of the pattern. |
How to Execute the Inverted Hammer Entry?
After you identify an inverter hammer, the next step is to plan to execute the trade. Professional traders never buy the moment they see the hammer; they will wait for confirmation.
The Confirmation Candle
The “confirmation” is the candle that follows the inverted hammer. You should see the next candle that closes above the high of the inverted hammer, this is a proof of the buyers have officially taken control, and the price is ready to move higher.
Stop-Loss and Targets
Place your order just below the low of the inverted hammer’s body. If the price falls below this, the “floor” has broken, and the pattern is invalid.
Conclusion: Is it Reliable?
Inverted hammer pattern is known as one of the more reliable single-candle signals, boasting an accuracy rate when confirmed by the next day’s price action. And keep in mind that, no pattern is 100% foolproof.
If you want to master the inverted hammer, combine it with other technical indicators like the Relative Strength Index (RSI). RSI shows the stock is “oversold” at the same time the hammer forms; you have a very high-probability trade on your hands.
Did you find this article helpful?
Your feedback helps us write better content.

Key Takeaways
- An inverted hammer is a bullish reversal candle at the bottom of a downtrend.
- Look for a small body, a long upper shadow (2x+ the body), and little to no lower shadow.
- Don’t confuse it with the shooting star, which appears at the top of an uptrend.
- Confirm with the next candle closing above the hammer’s high before entering.
- It is more reliable at support levels and when the RSI shows oversold conditions.
Frequently Asked Questions
Is an inverted hammer bullish?
Yes, the Inverted Hammer is a strongly bullish reversal pattern. According to backtesting data covering over 1,702 trades, the pattern predicts a bullish move approximately 60% of the time. While it can appear in red or green, a green Inverted Hammer is considered a slightly more powerful signal because it shows that buyers were able to close the session higher than where it opened.
What is the success rate of the inverted hammer pattern?
The reliability of the inverted hammer is timeframe-dependent: it acts as a modest bullish reversal signal on 30-minute charts (52.9% success) but frequently traps buyers on the 4-hour chart, where it results in a bearish continuation more often than a breakout.
What timeframe is best for inverted hammers?
While often used on daily charts, the inverted hammer is also a favorite for intraday traders on 5-minute to hourly timeframes, where it helps confirm bullish setups and strengthen trade conviction.
What is the best strategy for using the inverted hammer?
- Exercise Patience for Confirmation: An inverted hammer is a signal of intent, not a guarantee. Before entering, wait for the next candle to close significantly above the hammer high to prove the bulls have truly taken control.
- Create a “Confluence” of Indicators: Strengthen your case by looking for supporting evidence from other tools. If the RSI shows the asset is “oversold” or the MACD is starting with a bullish crossover, the signal carries much more weight.
- Identify Strategic Floors (Support): The pattern is far more reliable when it occurs at a “logical” price point, such as a previous historical low or a major moving average. This confirms that the market is finding value exactly where it has in the past.
What is the psychology behind an inverted hammer?
The Inverted Hammer tells a story of a failed bearish attack:
- The Struggle: Sellers are in control, but buyers suddenly stage a massive rally (creating the long upper wick).
- The Resistance: Sellers push back, but they fail to make new lows.
- The Shift: By the end of the session, the bears are exhausted. The long wick remains a “footprint” of buyer strength, signaling that the supply is drying up, and demand is finally taking over.
DISCLAIMER: Investment in securities market are subject to market risks, read all the related documents carefully before investing. The securities quoted are exemplary and are not recommendatory. Full disclaimer: https://bit.ly/naviadisclaimer.


