


The Price Rejection Alert: Understanding the Psychology of the Shooting Star
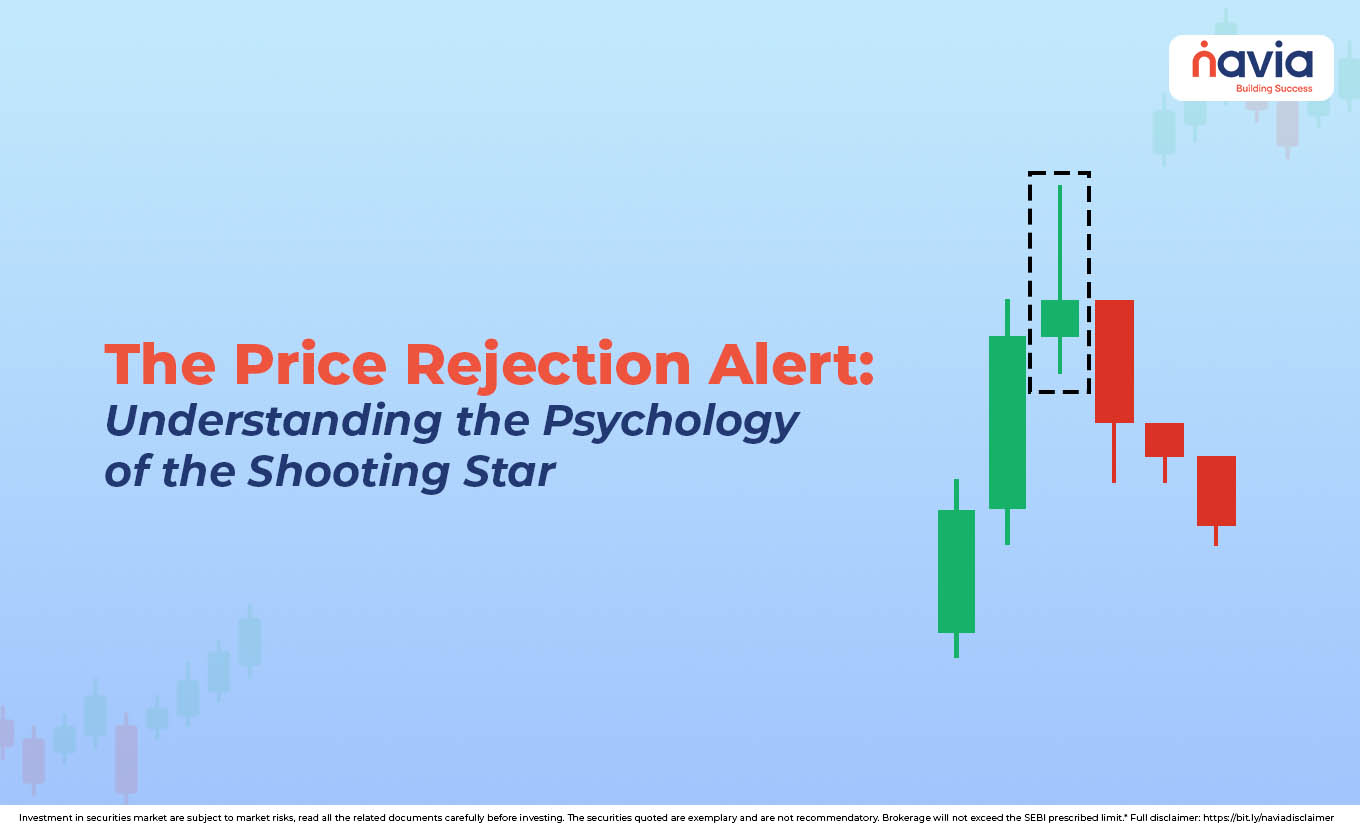
The world of trading is complex, right? But there is a most effective way for traders to gain an edge by decoding the visual language of candlestick patterns. These small charts can tell a powerful story about the battle between buyers (bulls) and sellers (bears) at a specific time.
Among the most easily recognizable bearish signal is the Shooting Star Candlestick Pattern. It’s a crucial warning sign that indicates a strong sustained buying trend may be about to end, and a downward reversal is on the horizon. If you are an investor to protect your gains or a trader seeking entry to a new position, understanding the pattern is a fundamental skill.
This guide will take you deep into what is a shooting star candlestick, the psychological significance, its formation, and the step-by-step process in detail.
💡 Quick Answer
A shooting star is a bearish reversal candlestick that forms after an uptrend. It has a small real body near the session low and a long upper wick at least two to three times the body length, with little or no lower wick. That long wick is the footprint of buyers pushing price sharply higher and then losing control as sellers drove it back down to the open. Traders treat it as a warning, not a trigger — the signal is confirmed only when the next candle closes below the shooting star’s low, ideally on rising volume and at a known resistance level.
What is Shooting Star Candlestick Pattern?
The shooting star candlestick pattern is a bearish reversal pattern that appears after an established uptrend. The name is derived from its visual appearance, because it looks like a star falling to earth with a long tail stretching above the main body.
The pattern signals the major shift in market sentiment, meaning that while the price was successfully pushed during the period, the bulls failed to maintain control. Sellers aggressively entered the market and pushed the price back down to close near where it opened. This strong rejection of higher prices is the core message of the shooting star candlestick.
It sits in the same family of single-candle reversal signals as the hanging man pattern and the bullish hammer candlestick pattern, which is effectively its mirror image at the bottom of a downtrend.
Anatomy and Interpretation of the Candle Shooting Star
The visual appearance of the candle shooting star contains all the necessary information to interpret the market’s internal struggle:
| Long Upper Wick | The upper shadow (wick) must be at least two or three times the length of the real body. It represents the market’s failed attempt to sustain prices at a high level. |
| Small Real Body | Distance between the open and close prices form the real body. It is small and situated near the low of the trading range, and it indicates price volatility. |
| Little to No Lower Wick | The absence of a lower shadow confirms that once the selling pressure began, the price generally stayed low. |
The formation of a shooting start candlestick pattern is like a dramatic visual of an exhausted bull market:
- The Rally (Long Wick): The trading period starts, and buyers initially dominate pushing the price significantly higher, continuing the prior uptrend.
- The Rejection (Small Body): At the peak, profit-taking and new short entries flood the market. Sellers take over and erase all the gains.
- The Signal: By the close, the price is back near the opening level. The resulting long upper wick is the footprint of the bulls’ catastrophic failure. This rejection warns traders that the path of least resistance has likely turned downward.
The color of the body is secondary, but if the body is red (closing lower than the open), that signals slightly stronger.

Trading the Shooting Star Candle Pattern: Entry and Exit Strategy
We know that identifying the shooting star candle pattern is crucial, but successful trading depends on the right application of strategy and risk management.
Step 1: Identification & Confirmation
First you must spot the clear, well-formed shooting star candlestick at the top of an uptrend. Ensure that the upper wick is at least twice the size of the body. After the identification, wait for the next candle, the confirmation candle, to start the action. After the confirmation of the pattern, if the candle is bearish and its price closes below the low of the shooting start candle.
This follow-through confirms that the sellers are in control. Traders can also look for an increase in trading volume during the confirmation candle, which adds institutional weight to the reversal.
A two-candle confirmation such as the dark cloud cover pattern or a bearish harami candlestick pattern immediately after the shooting star adds further weight to the reversal case.
Step 2: Entry
There are two types of entries;
- Aggressive Entry: Some experienced traders enter a short position immediately after the shooting star candle closes.
- Conservative Entry: The safer and recommended approach is to enter a short position when the price breaks and closes below the low of the shooting star candlestick. This ensures the new downtrend has officially begun.
Step 3: Risk Management (Stop-Loss and Take Profit)
Where Should You Place the Stop-Loss?
Place your stop-loss order slightly above the high of the shooting star’s upper wick. If the price rises past this level, the initial bearish signal is invalidated, and the uptrend is likely continuing, making a quick exit essential to preserve capital.
Where Should You Take Profit?
Target the nearest strong support level established by prior price action. Alternatively, use a trailing stop-loss to let the trade run for maximum benefit as the price moves downward.
Considerations for Maximum Reliability
The shooting star candlestick pattern is a powerful indicator, but no pattern works 100% of the time. If you want to increase its reliability you must follow the points given below;
- A valid shooting star should ideally be formed or followed by high trading volume. It suggests that the large-scale rejection was caused by institutional selling, making the reversal more robust.
- A shooting star that forms precisely at a major, proven resistance zone (where price has reversed before) or a key Fibonacci level is exponentially more reliable than one that appears randomly.
- Always seek additional confirmation. Pairing the shooting star with an overbought reading on the Relative Strength Index (RSI) or a bearish crossover on the Moving Average Convergence Divergence (MACD) can significantly boost your confidence in the trade. A break of the simple moving average indicator in the same direction is another useful filter.
- Read the pattern inside the wider trend structure. The primary, secondary and minor trends described by Dow Theory tell you whether a single bearish candle is a genuine turning point or just noise inside a strong uptrend.
- Stick to your stop-loss, because uptrends can be long and powerful;even a strong single-candle reversal signal can sometimes be absorbed by the market.
Conclusion
If you are trying to analyze the market in the technical perspective, the shooting star candlestick pattern is the fundamental tool for you. Because it offers clear, immediate and high-probability signals of an impending trend of reversal. But keep in mind the major points like identifying long upper wick, confirming the rejection with subsequent bearish price action, and strictly applying risk management rules.
So, by utilizing the warning sign of the shooting stars candlestick will protect your capital and profit from the ensuing downtrend. Master this pattern, and you master the art of predicting market turns. Once you are comfortable reading rejection candles, the natural next steps are the three-candle evening star candlestick pattern, the full-bodied Marubozu candlestick pattern, and the multi-layered Ichimoku Cloud.
Key Takeaways
- A shooting star is a bearish reversal candle that only carries meaning after an established uptrend.
- The defining shape is a small real body near the low, an upper wick two to three times the body, and little or no lower wick.
- The pattern is a warning, not an entry — wait for a confirmation candle that closes below the shooting star’s low.
- Reliability rises sharply when the candle forms at a proven resistance zone and on heavy volume.
- Place the stop-loss just above the upper wick; a close above it invalidates the signal.
- Confirm with a second tool — Relative Strength Index (RSI), Moving Average Convergence Divergence (MACD) or a moving average — rather than trading the candle alone.
Did you find this article helpful?
Your feedback helps us write better content.

Frequently Asked Questions
Is shooting star bullish or bearish?
The Shooting Star candlestick pattern is a bearish reversal signal. It appears at the top of an uptrend and indicates that buyers (bulls) have failed to sustain higher prices, and sellers (bears) have taken control, suggesting the price is likely to move down.
Is a shooting star lucky or unlucky?
In the context of trading and technical analysis, the Shooting Star pattern is neither lucky nor unlucky; it is simply a signal of market rejection.
How to spot shooting stars?
To spot a Shooting Star candlestick on a price chart, look for these three characteristics, which must appear after a noticeable uptrend:
- Small Real Body: The candle body (the difference between the open and close) is very small and located near the low of the price range.
- Long Upper Shadow: The upper wick is at least two to three times longer than the small real body.
- Little to No Lower Shadow: There should be minimal or no wick below the real body.
Is it good to see shooting stars?
In technical analysis, yes, it is good to see a Shooting Star if you are a seller or a short-term trader. Some traders use it as a visual cue suggesting potential exhaustion in an existing upward move.
Do professional traders use candlestick patterns?
Yes, professional traders and institutional analysts widely use candlestick patterns, including the Shooting Star.
DISCLAIMER: Investment in securities market are subject to market risks, read all the related documents carefully before investing. The securities quoted are exemplary and are not recommendatory. Full disclaimer: https://bit.ly/naviadisclaimer.


