

Understanding Candlestick Patterns: A Simple Guide for Traders
As a trader, you’ve probably come across the term candlestick patterns, widely used by traders as one of the tools to analyze potential price movements. But if you’re new to trading, candlestick patterns might sound a bit overwhelming. Don’t worry – we’re here to break it down in simple terms and show you how you can use them for trading!
What Are Candlestick Patterns?
A candlestick is a chart representation of price movement over a specific time period, such as 1 minute, 1 hour, or 1 day. Each candlestick consists of four parts:
● Open: The price at which an asset starts trading during a specific time period
● Close: The price at which an asset finishes trading during the time period
● High: The highest price reached during the time period
● Low: The lowest price reached during the time period
The Components of a Candlestick:
● The body of the candlestick represents the range between the open and close prices.
● The wicks (or shadows) above and below the body show the high and low prices reached during that time period.
If the close is higher than the open, it is a bullish (green) candle, indicating that the price went up during that time period. If the close is lower than the open, it’s a bearish (red) candle, indicating that the price went down.
Why Candlestick Patterns Matter in Trading?
Candlestick patterns help traders identify potential price trends and reversals. By recognizing these patterns, traders can make informed decisions about when to buy or sell an asset.
For instance, certain patterns indicate bullish trends (when prices are likely to rise), while others suggest bearish trends (when prices are likely to fall). Understanding and interpreting these patterns can give traders a clear edge.
Popular Candlestick Patterns and Their Meaning
Here are a few common candlestick patterns that traders use to make decisions:
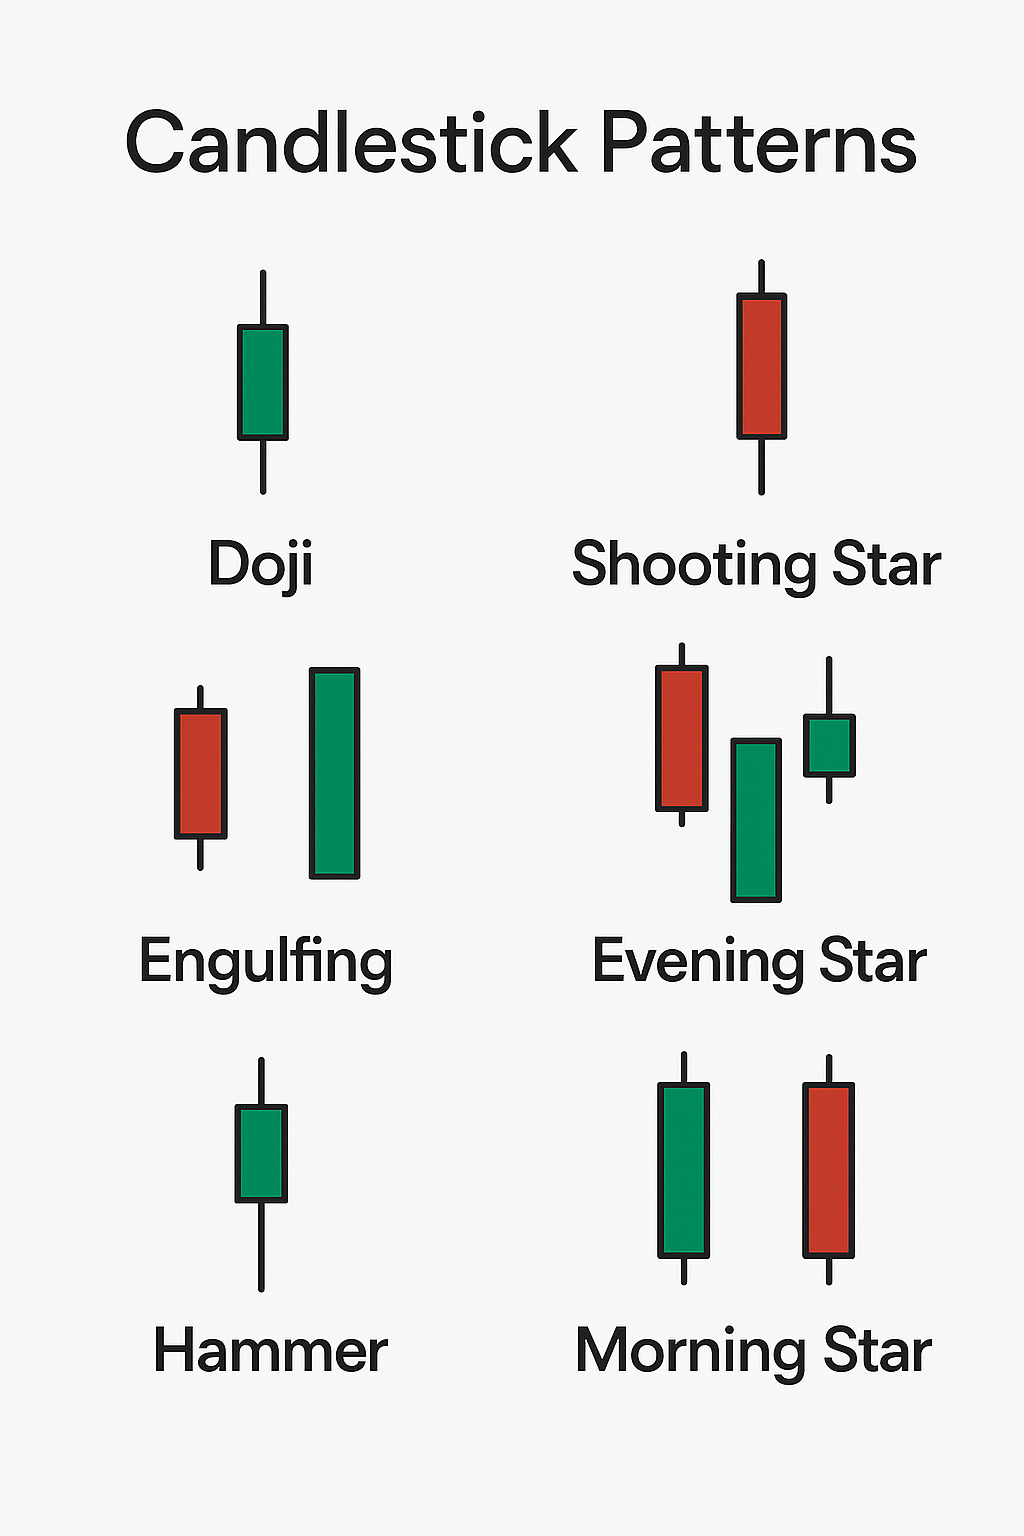
1. Doji
A Doji is a candlestick where the open and close prices are almost the same, indicating indecision in the market. It is a neutral pattern, often signaling a potential trend reversal.
🠖 Bullish Reversal: A Doji after a downtrend could indicate the start of an upward movement
🠖 Bearish Reversal: A Doji after an uptrend could suggest a potential decline in price
2. Engulfing Pattern
The Engulfing pattern occurs when a large candlestick fully engulfs the previous smaller candlestick. There are two types:
🠖 Bullish Engulfing: When a small red candle is followed by a large green candle. This indicates that buyers have gained control, signaling a possible upward price movement.
🠖 Bearish Engulfing: When a small green candle is followed by a large red candle. This suggests that sellers have gained control, and prices may fall.
3. Hammer
The Hammer candlestick has a small body and a long wick below, and it looks like a “hammer.” This pattern usually appears after a downtrend and suggests that buyers are starting to take control, possibly signaling a price reversal to the upside.
🠖 Bullish: A hammer in a downtrend is often interpreted by some traders as a potential buying signal, though outcomes vary.
4. Shooting Star
The Shooting Star is the opposite of the Hammer, with a small body and a long wick above. It appears after an uptrend and can signal that buyers are losing control, and a downward trend may follow.
🠖 Bearish: A shooting star is often interpreted by some traders as a potential selling signal, though outcomes vary.
5. Morning Star
The Morning Star is a three-candle pattern:
1. A long bearish candle (red)
2. A small candle (indicating indecision)
3. A long bullish candle (green)
It often appears after a downtrend and signals a potential bullish reversal.
6. Evening Star
The Evening Star is the opposite of the Morning Star:
1. A long bullish candle (green)
2. A small candle (indicating indecision)
3. A long bearish candle (red)
This pattern suggests that after an uptrend, the market may soon experience a bearish reversal.

How to Use Candlestick Patterns in Trading?
To use candlestick patterns effectively, here’s what you need to keep in mind:
1. Look for Context:
Candlestick patterns are more powerful when viewed in the context of the trend. For instance, a bullish engulfing pattern in an uptrend can be more reliable than in a sideways market.
2. Combine with Other Indicators:
Use candlestick patterns alongside other technical indicators (like RSI, MACD, or Moving Averages) to confirm potential price movements. Combining multiple signals helps reduce the risk of false signals.
3. Risk Management:
Always set stop-loss orders to limit potential losses. Candlestick patterns help identify potential price movements, but the market can be unpredictable, so manage your risk appropriately.
4. Practice:
Start by practicing with demo accounts to understand how candlestick patterns work in real-time trading without risking real money.
Key Takeaways
🔸 Candlestick patterns are visual representations of price movements that help traders make better predictions.
🔸 Understanding patterns like Doji, Engulfing, Hammer, and Shooting Star can provide you with valuable insights into potential market movements.
🔸 Combine candlestick patterns with other technical analysis tools and risk management strategies to make informed trading decisions.
By incorporating candlestick patterns into your trading strategy, you can gain a deeper understanding of market sentiment and help you interpret price charts more effectively. Use cautiously and with proper risk management
Do You Find This Interesting?
We’d Love to Hear from you-

DISCLAIMER: Investments in securities market are subject to market risks, read all the related documents carefully before investing. The securities quoted are exemplary and are not recommendatory. Full disclaimer: https://bit.ly/naviadisclaimer.


