


Bearish Abandoned Baby Pattern: Structure, Psychology and Market Interpretation
- What is the Abandoned Baby Candlestick Pattern?
- Anatomy of the Bearish Abandoned Baby Pattern
- The Bullish Side: When the Trend Rebounds
- Market Psychology: Why the u0022Babyu0022 is Abandoned
- How Market Participants Commonly Analyse the Pattern?
- Common Pitfalls to Avoid
- Conclusion
- Frequently Asked Questions
In technical analysis, some signals whisper while others shout. However, there is a specific formation that represents a complete “void” in the market—a moment when the trend doesn’t just stop but is completely deserted by its previous masters. This is an abandoned baby candlestick pattern.
Whether you are navigating a roaring bull market or a deep correction, understanding the bullish and bearish abandoned baby candlestick pattern is essential for any trader who wants to understand potential changes in market sentiment. This guide breaks down the mechanics, psychology, and trading strategies for reliable reversal signals.
💡 Quick Answer
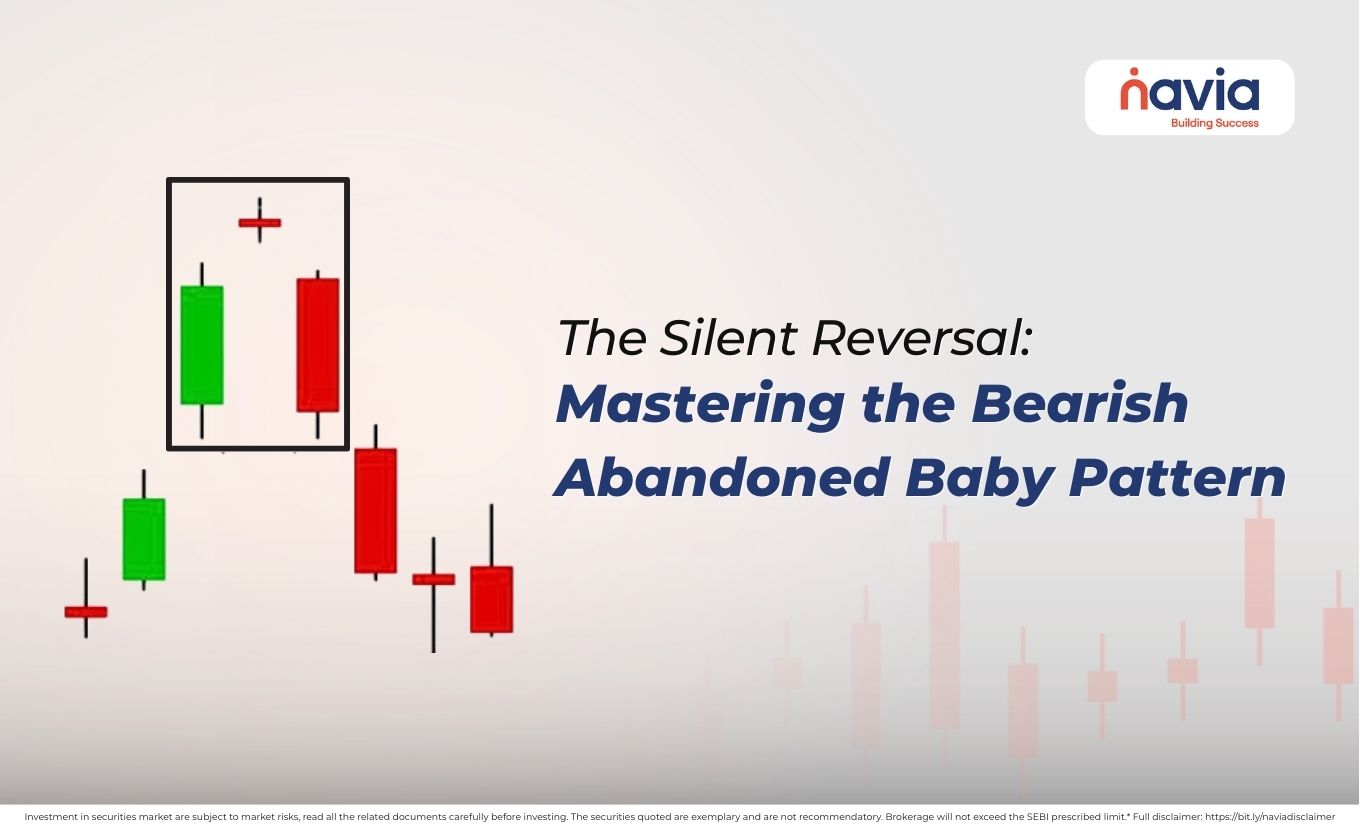
The bearish abandoned baby is a rare three-candle reversal at the top of an uptrend: a large green candle, a gapped-up Doji whose shadows do not touch the candles on either side, then a large red candle that gaps down. The isolated “baby” Doji marks a total vacuum of buying pressure and often precedes a sharp fall.
What is the Abandoned Baby Candlestick Pattern?
The abandoned baby candlestick pattern is a rare, three-bar reversal formation. It is distinctive because it features a “Doji” that is completely separated from the candles on either side by gaps.
This physical separation on the chart is why it is called an “abandoned baby.” The price has moved so fast that it left a lone candle “abandoned” in a price vacuum.
The Two Faces of the Pattern:
| Bullish Abandoned Baby Candlestick Pattern | Occurs at the bottom of a downtrend, signaling a sharp turn to the upside. |
| Bearish Abandoned Baby Candlestick Pattern | Occurs at the peak of an uptrend, signaling a collapse in price. |
Anatomy of the Bearish Abandoned Baby Pattern
The bearish abandoned baby pattern is commonly interpreted as a bearish reversal formation by technical analysts. To identify a true bearish abandoned baby candlestick pattern, you must look for three specific criteria:
| Candle 1 | A large bullish (green) candle that continues the existing uptrend. |
| Candle 2 | A Doji (the baby candlestick pattern component), this candle must gap up so that its shadows do not overlap with the previous candle. |
| Candle 3 | A large bearish (red) candle that gaps down from the Doji. Again, there should be no overlap between the shadows of the Doji and this third candle. |
This “triple gap” structure makes the bearish baby candlestick pattern widely recognised than a standard “Evening Star.” It shows that the bulls were so exhausted at the peak that they couldn’t even maintain a presence at the Doji’s price level.
The Bullish Side: When the Trend Rebounds
While the focus today is on the downturn, a complete trader must recognize the bullish abandoned baby candlestick pattern. This is the mirror image of the bearish version.
In this scenario, a large red candle is followed by a Doji that gaps downward. The third candle is a large green candle that gaps upward. This pattern abandoned baby signals that the sellers have completely run out of ammunition, and some analysts interpret the pattern as a potential indication of improving bullish sentiment.
Market Psychology: Why the “Baby” is Abandoned
The effectiveness of the bearish abandoned baby candlestick pattern lies in the shock it delivers to market participants.
- Overextension: On the first day, everyone is bullish. The trend looks unstoppable.
- The Exhaustion: On the second day, the market gaps up due to residual excitement, but no new buyers enter. The price flatlines, creating the Doji. The “baby” is now isolated at the high.
- The Panic: On the third day, the market opens significantly lower. Every trader who bought on Day 1 or Day 2 is now in a losing position. This may result in increased selling activity as market participants reassess positions.

How Market Participants Commonly Analyse the Pattern?
Because this pattern is rare, it is considered commonly studied. Here is how to execute a trade when you spot it (educational purpose only):
| The Entry | The most common entry for a bearish abandoned baby pattern is at the close of the third candle. In high-frequency environments, waiting for the daily close ensures that the “gap” remains open and hasn’t been filled by intraday noise. |
| Stop-Loss Placement | The stop-loss should be placed just above the high of the Doji (the “abandoned baby”). Since this high represents a complete rejection of price, any move back above it invalidates the reversal. |
| Confirmation with Indicators | Always pair the bearish abandoned baby candlestick pattern with volume. You want to see high volume on the first and third days, but very low volume on the Doji day. This confirms that the peak was a result of a lack of buyers rather than a battle between bulls and bears. |
Common Pitfalls to Avoid
- Ignoring the Shadow: If the wicks (shadows) of the Doji touch the wicks of the surrounding candles, it is technically an Evening Star, not an abandoned baby candlestick pattern. The gaps must be absolute.
- Trading in Low Liquidity: In “penny stocks” or low-volume assets, gaps happen frequently due to a lack of trade. Market participants often consider liquidity and trading volume when evaluating chart patterns or indices like the Nifty.
- News Events: Sometimes a bearish abandoned baby pattern forms purely due to a news-driven gap. Always check if the reversal aligns with the broader sector trend.
Conclusion
The bearish abandoned baby candlestick pattern is one of the most visually striking and often discussed by technical analysts. It captures a moment of total market transition. While you won’t see it every day, when the pattern abandoned baby does appear, it demands your full attention.
By mastering both the bullish and bearish abandoned baby candlestick pattern, you equip yourself with a tool that can navigate the most extreme market pivots. As always, use these patterns as part of a broader strategy that includes proper risk management and trend analysis. To extend your gap-based toolkit, compare it with the bearish kicker pattern and the bearish three outside down pattern.
Do You Find This Interesting?
We’d Love to Hear from you-

Related Candlestick Patterns
- Bearish Kicker pattern
- Bearish Mat Hold pattern
- Three Inside Down pattern
- Bearish Three Outside Down pattern
- Three Inside Up pattern
- Three Outside Up pattern
- Bullish Kicker pattern
- Tweezer Top pattern
- Tweezer Bottom pattern
Key Takeaways
- A rare three-candle reversal defined by two absolute gaps around a Doji.
- Bearish version tops an uptrend; bullish version bottoms a downtrend.
- The Doji’s shadows must not overlap the neighbouring candles—otherwise it is an Evening Star.
- Look for high volume on candles 1 and 3, but low volume on the Doji.
- Trade only on liquid stocks or indices to avoid false, low-volume gaps.
Frequently Asked Questions
What is a bearish abandoned baby?
The bearish abandoned baby is a rare and highly reliable three-candle reversal pattern that marks the top of an uptrend. It is defined by three specific components:
1. A large bullish candle (green).
2. A Doji candle (the “baby”) that gaps completely above the first candle, meaning its shadows do not touch the previous candle’s shadows.
3. A large bearish candle (red) that gaps completely below the Doji. This “island” of a Doji at the top represents a total vacuum of buying pressure, signaling an immediate collapse.
What is the strongest bearish pattern?
While “strength” is subjective, the Bearish Abandoned Baby and the Bearish Kicker are widely considered the strongest. This is because they involve gaps. A gap indicates that the shift in sentiment was so violent that no trading occurred at certain price levels. Other strong patterns include the Evening Star and the Bearish Engulfing, though they lack the “gap” intensity of the Abandoned Baby.
Is bearish candle buy or sell?
A bearish candle is a sell signal. It indicates that sellers (bears) have won the battle for that specific time, pushing the closing price lower than the opening price.
➔ In a downtrend: It confirms the trend is continuing.
➔ At the top of an uptrend: It warns of a potential reversal, suggesting you should exit long positions or consider short selling.
What is the most powerful reversal pattern?
The Abandoned Baby (Bullish or Bearish) is often cited as the most powerful reversal pattern because of the “Triple Confirmation”:
1. Exhaustion (The first large candle).
2. Indecision/Gap (The Doji).
3. Rejection/Gap (The third confirming candle). Because it is so rare, when it does appear, it carries significantly more weight than common patterns like the “Hammer” or “Shooting Star.”
What do I do with an abandoned baby?
If you spot an abandoned baby pattern on your chart, follow these professional steps:
✔ On a Bearish Pattern: Prepare to Sell. Place a short order at the close of the third candle.
✔ On a Bullish Pattern: Prepare to Buy. Enter a long position once the third candle confirms the upward gap.
✔ Set Your Stop-Loss: For a bearish setup, place your stop-loss just above the high of the Doji (the “baby”).
✔ Check Liquidity: Only trade this pattern on high-volume stocks or indices (like the Nifty 50) to ensure the gaps aren’t just “noise” from low trading activity.
DISCLAIMER: Investment in securities market are subject to market risks, read all the related documents carefully before investing. The securities quoted are exemplary and are not recommendatory. Full disclaimer: https://bit.ly/naviadisclaimer.


