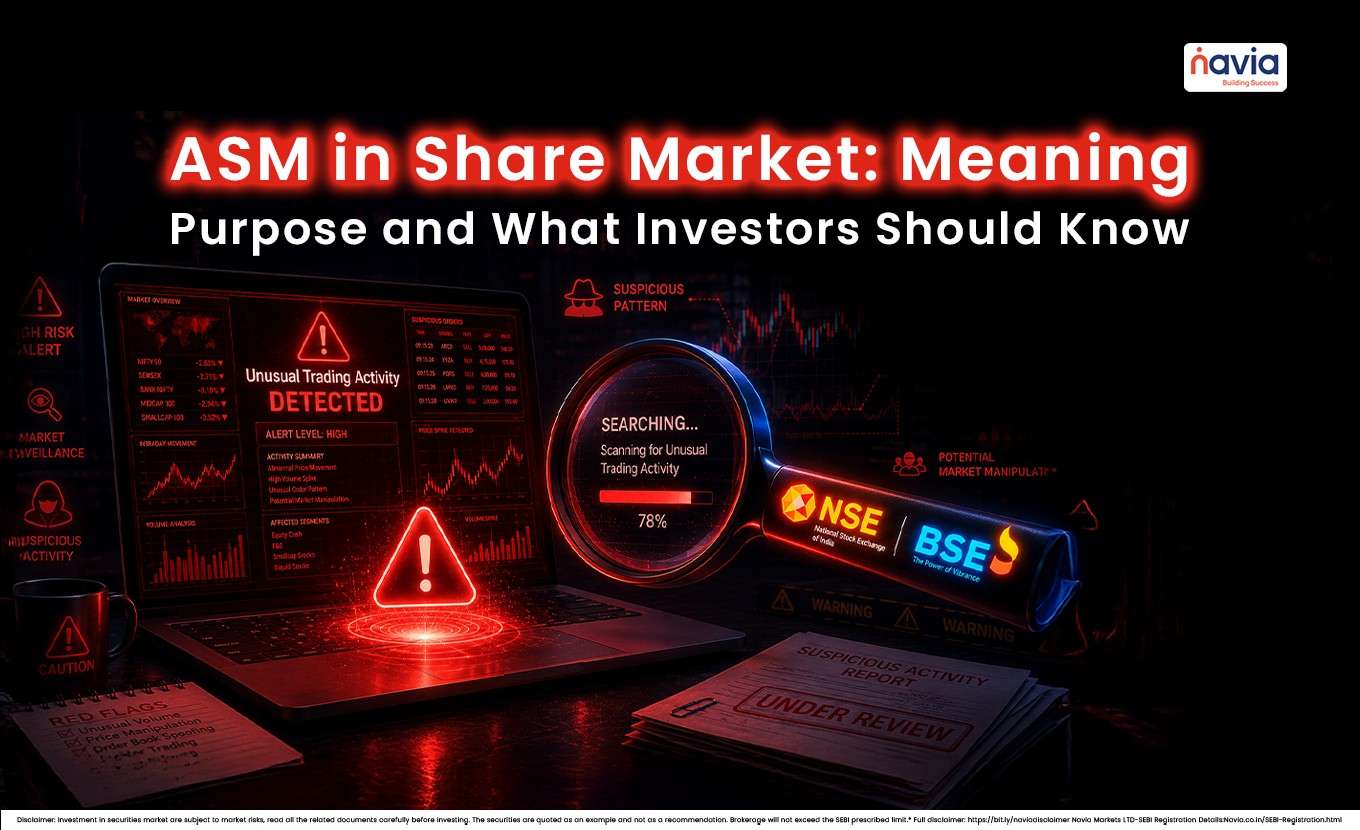
ASM in Share Market: Meaning, Purpose and What Investors Should Know
- What is ASM? Full Form, Origin and Purpose
- What Triggers ASM?
- How ASM Affects Traders and Investors?
- ASM vs GSM — Two Different Surveillance Signals
- Conclusion
- Frequently Asked Questions
ASM in share market is a term many investors notice when a stock suddenly appears on a special watchlist. The ASM full form is Additional Surveillance Measure, and it is used by Indian stock exchanges to monitor securities that show unusual trading behavior.
For investors, this matters because an ASM tag is not just a label; it is a signal that the stock is under tighter monitoring due to market concerns. In simple words, it helps bring more caution, more transparency, and better market discipline.
What is ASM? Full Form, Origin and Purpose
ASM stands for Additional Surveillance Measure. It is a joint surveillance mechanism introduced by SEBI and the Indian stock exchanges (NSE and BSE) in 2018 to identify and monitor securities showing unusual price movement, abnormal volumes, or trading patterns that warrant enhanced surveillance by exchanges.
Why Was It Introduced?
🔶 To help identify unusual trading activity and strengthen investor protection through enhanced market surveillance.
🔶To improve market integrity by creating a visible, transparent mechanism that flags stocks under watch.
🔶To deter manipulation by imposing economic costs (100% margin, no leverage) that make pump-and-dump schemes harder to execute profitably.
🔶To alert market participants before a situation escalates — ASM is a pre-emptive tool, not a post-event action.
What Triggers ASM?
The entry criteria for ASM are objective, quantitative, and jointly decided by SEBI and exchanges. A stock must meet specific thresholds — not subjective judgements — to be placed on the list. The list is reviewed and updated daily, with the effective date typically T+1 from the circular.
| Parameter | What It Measures | Indicative Surveillance Factors Considered by Exchanges | Why It Matters |
|---|---|---|---|
| Close-to-Close Price Variation | Daily closing price change vs prior close | more than or equal to 25% in 5 consecutive trading days (adjusted for corporate actions) | Catches sudden, sustained price jumps not linked to known news |
| High-Low Price Variation | Intraday price range as % of price | Excessive intraday swings vs market average | Signals manipulation via intraday ramping and dumping |
| Monthly Volume Variation | Current month volume vs 3-month average | Volume surge more than 500% vs 3-month average on NSE+BSE combined | Sudden volume spikes without news = potential circular trading signal |
| Client Concentration | % of trading by top 25 unique PANs | Top 25 clients account for more than 25% of combined monthly volume | Few accounts driving most of volume = possible coordinated activity |
| Delivery Percentage | Shares actually delivered vs total traded | Average delivery less than 30% of traded volume | Low delivery = speculative churn, not genuine investment buying |
| Market Capitalisation | Total market cap of the company | Various thresholds: more than Rs.500 cr, more than Rs.100 cr, less than Rs.500 cr depending on stage | Larger caps use different criteria to avoid flagging established companies |
| Beta-Adjusted Price Move | Stock price move relative to index move | Close-to-close variation greater than (100% + Beta x Nifty variation) over 60 or 365 days | Removes market-wide moves; isolates stock-specific unexplained movement |
IMPORTANT: A stock satisfying even ONE of the criteria can be shortlisted for ASM — exchanges do not require all parameters to be triggered simultaneously. The combination of criteria that triggers the flag is disclosed in the exchange circular issued on the day of entry. Always read that circular first.

How ASM Affects Traders and Investors?
The practical impact of ASM varies significantly depending on whether you are a long-term investor or an active trader. The table below covers every dimension of impact and what it means for each participant.
| Aspect | What Changes Under ASM | Impact on Retail Investor | Impact on Trader/Speculator |
|---|---|---|---|
| Margin Requirement | Increases to 100% of trade value — full upfront payment required | Must have full cash; no leverage or BTST on margin | Eliminates intraday leverage; position sizing constrained significantly |
| Intraday Trading | Banned in ASM securities | Cannot use MIS/BO order types; must take delivery | Scalping and intraday trading completely unavailable |
| Price Band | Reduced to 5% circuit filter (from 10–20%) | Limits daily gain/loss to 5%; entry/exit price range narrow | Reduces risk of extreme single-day loss; also limits recovery speed |
| Pledging as Collateral | Not allowed for ASM stocks | Cannot use ASM stock as margin collateral for other trades | Portfolio margin calculations change; existing collateral may be recalled |
| Liquidity | Often decreases as traders avoid the stock | Bid-ask spreads may widen; harder to exit large positions | Slippage risk increases; market impact cost higher for bulk trades |
| Derivatives Contracts | Long-term ASM Stage 3-4: new F and O contracts not issued; existing contracts run to expiry | F and O hedging on the stock unavailable if it escalates | Option and futures strategies on the stock become unavailable or illiquid |
| Sentiment and Price | ASM tag itself often causes selling pressure | Price may fall on the announcement day irrespective of fundamentals | Creates possible dip-buying or short-selling opportunities, but with high risk |
ASM vs GSM — Two Different Surveillance Signals
Many investors confuse ASM with GSM (Graded Surveillance Measure). They are related but distinct frameworks targeting different risk profiles. A stock can be under ASM, GSM, both, or neither.
| Feature | ASM (Additional Surveillance Measure) | GSM (Graded Surveillance Measure) |
|---|---|---|
| Primary Focus | Unusual price/volume activity — manipulation or speculation signals | Price not commensurate with fundamentals — overvalued relative to financials |
| Trigger Type | Market-behaviour based (volume surge, price spikes, client concentration) | Fundamental mismatch (P/E, book value, earnings vs market price) |
| Who It Targets | Any stock — including large-caps and mid-caps — showing unusual trading | Typically smaller companies whose price has ‘run ahead’ of their business |
| Stages | Short-term (2 stages) + Long-term (4 stages) | 6 graded stages from Stage I to Stage VI (progressively stricter) |
| Trading Impact | 100% margin, intraday banned, 5% circuit | Periodic call auction, trade-for-trade, higher margins — increasingly restrictive by stage |
| Severity Indicator | Surveillance concern — does not imply fundamental weakness | Stronger warning — suggests possible overvaluation or financial risk |
| SEBI Circular Reference | NSE/SURV/46557, NSE/SURV/52144, NSE/SURV/58558 | Separate GSM circular framework — published independently by NSE/BSE |
Conclusion
ASM stands for Additional Surveillance Measure, and it is one of the ways exchanges and SEBI monitor unusual stock activity in the market. Understanding asm in share market helps investors interpret warnings more clearly and make better decisions instead of reacting blindly.
When you see an ASM tag, treat it as a signal to conduct additional due diligence and understand the reasons for enhanced surveillance. In that sense, ASM is less about fear and more about awareness, discipline, and investor protection.
Did You Find This Interesting?
We’d Love to Hear from you-

Frequently Asked Questions
What does ASM mean in share market?
ASM stands for Additional Surveillance Measure. It is a SEBI and exchange mechanism to monitor stocks with unusual price, volume, or trading pattern behavior — introduced in 2018 to protect investors and maintain market integrity.
Can I do intraday trading in an ASM stock?
No. Intraday trading (MIS, BO, CO order types) is banned in ASM securities. You must take delivery and pay 100% of the trade value upfront. This is the most significant trading impact for active traders.
What is the difference between ASM and GSM?
ASM targets unusual trading behavior (volume, price pattern, client concentration). GSM (Graded Surveillance Measure) targets stocks where price appears unjustified by fundamentals (overvalued relative to earnings, book value). GSM has 6 progressively stricter stages and is generally a stronger warning signal.
How do I find out if a stock is under ASM?
Check the NSE ASM report page: nseindia.com/reports/ASM, or the BSE equivalent. Most broker platforms also display an ASM tag on the order screen. The list is updated daily aftermarket hours, effective from T+1.
DISCLAIMER: Investment in securities market are subject to market risks, read all the related documents carefully before investing. The securities quoted are exemplary and are not recommendatory. Full disclaimer: https://bit.ly/naviadisclaimer.