


Twilight Warning: Mastering the Bearish Evening Star Candlestick Pattern
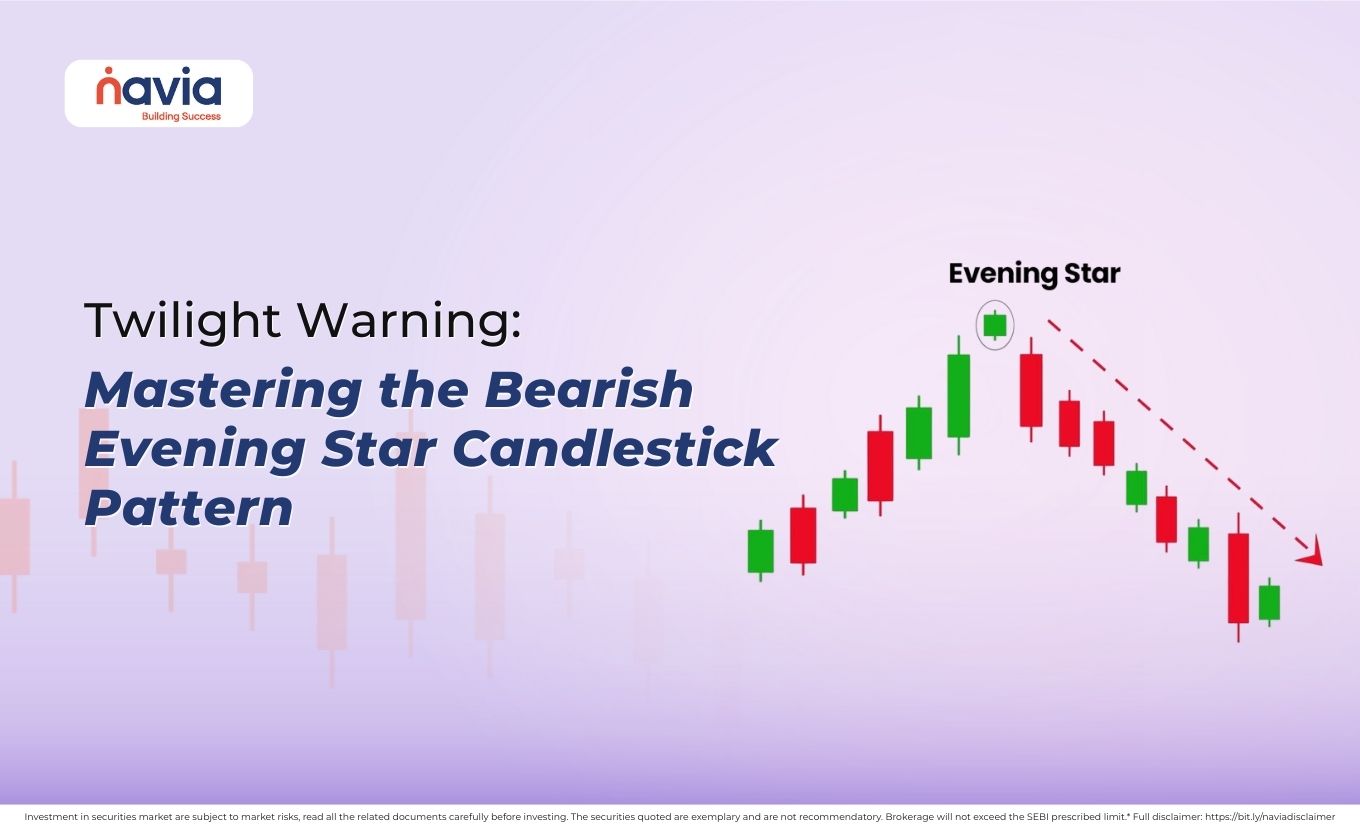
In the financial markets story, the candlestick patterns are the key vocabulary. We know that the bullish patterns signal growth and opportunity, and the bearish reversal signals protect capital and allow traders to lock their gains. Among these reliable signals, evening star patterns get the complete attention of the traders.
The evening star pattern is a three-candle formation that heralds the end of an uptrend, much like the evening star (Venus) signals the end of the day. Its appearance at the peak of a market rally suggests that the bullish momentum is exhausted, and a decline is approaching.
This comprehensive guide will help you understand the structure, market psychology, and strategic use of this bearish reversal pattern in detail.
💡 Quick Answer
The evening star is a three-candle bearish reversal pattern that forms at the top of an uptrend: a long bullish candle, then a small-bodied candle that gaps up and shows indecision, then a long bearish candle that closes deep inside the first candle’s body. It marks the handover from buyers to sellers, and it is the exact mirror of the bullish morning star pattern.
What is the Evening Star Pattern?
The evening star pattern is a widely recognized bearish reversal signal. This three-candle pattern forms at the top of an uptrend, and the structure visually represents the transition from bullish to bearish dominance. It is a distinct warning of market is preparing for a significant downward move, which helps the investor to make good decisions.
Remember that for a valid evening star pattern, you must be preceded by a clear uptrend. If this pattern forms a sideways market or an existing downtrend, its predictive power significantly decreases.
Flip the sequence and you get its bullish counterpart, the morning star candlestick pattern, which forms at the bottom of a downtrend. Traders who want a longer bearish confirmation often pair it with the three black crows pattern.
Anatomy of the Evening Star Pattern Candlestick
The power of the evening star pattern candlestick lies in the specific sequence and relationship of its three components, that are given below;
| The First Candle (The Bullish Dominance) | It’s a large and bullish candle that confirms the strength of existing uptrends. It closes strongly, that indicates the buyers are firmly in control and driving prices higher. |
| The Second Candle (The Star/Indecision) | It’s a small candle, and it ‘gaps up’ from the first candle. The smaller size of it indicated market indecision. The small body, whether bullish or bearish, signals that momentum has halted. |
| The Third Candle (The Bearish Confirmation) | It’s a large and bearish candle, that closes deep into the body of the first bullish candle, often gapping down from the second candle. This is confirmation that the sellers have seized control. |
The overall image of the evening star pattern is, strong candle (day 1), followed by a tiny pause (day 2), and decisive candle (day 3) pulls the price dramatically lower.
That middle candle is the hinge of the whole formation. When it stretches into a long-wicked bar of pure indecision, it is worth reading our note on the long-legged doji as well.

What is the Psychology Behind the Evening Star Pattern?
The candlestick evening star pattern reveals the critical shift in market psychology; here is the reasons:
Day 1: Euphoria
The market is bullish; conviction is high and large green candle that confirms the strong uptrend of the market. At this time the investors are happy and may chase the price higher.
Day 2: Hesitation
The market continuously attempts to continue higher but fails. The small body shows that buyers could not maintain the aggressive push, and sellers successfully prevented a strong close.
Day 3: Panic and Capitulation
The market opens lower than the previous day; this gap down sends a negative signal. Throughout the day, the large red candle closes deep into the territory of the first bullish day. This price action convinces the buyers to sell, that leads to the start of the downtrend.
This three-day sequence captures the market’s transition from optimism to doubt and finally into fear.
A single candle can deliver the same warning in one session. The hanging man pattern and the two-candle dark cloud cover pattern both flag the same loss of buyer control at a market top.
How to Execute the Evening Star Pattern?
The evening star pattern is a powerful first step, but disciplined trading needs confirmation and strict risk management.
| Context and Confirmation | First, you must locate the complete three-candle evening star pattern at the market top or strong resistance level. The third candle is the confirmation tool, so for a high probability trade you should wait for the price to break below the low of the first candle. |
| Entry and Stop-Loss | Entry: Enter short positions when the price breaks below the low of the third bearish candle. This is the standard conservative entry point. Stop Loss: Place your stop-loss order slightly above the high of the second candle (the Star). It will represent the peak of the rally before the bears take control. Take Profit: Target the nearest significant support level from prior price action to manage the trade as the price moves downward. |
Conclusion: Don’t Ignore the Twilight Signal
The evening star candlestick pattern is a classic tool for the technical trader’s weapons. Its three-step sequences clearly illustrate the market’s transition from euphoria to fear, warning an impending market decline to the traders.
By seeking out the candlestick evening star pattern at market tops, waiting for the bearish confirmation and applying disciplined risk management will help you place your stop-loss above the high of the star. So, heed the twilight warning of the evening star and navigate the volatile turning points of the financial market easily.
Key Takeaways
- The evening star is a three-candle bearish reversal pattern, and it only carries that meaning at the top of a clear uptrend.
- Candle one is a long bullish candle, candle two is a small-bodied star that gaps up and signals indecision, and candle three is a long bearish candle.
- The third candle must close deep inside the body of the first candle for the pattern to be convincing.
- The colour of the middle star candle does not matter; what matters is that its small body shows momentum has stalled.
- The pattern is the exact opposite of the morning star, which forms at the bottom of a downtrend and signals a bullish reversal.
- Enter short below the low of the third candle, place the stop-loss above the high of the star, and target the nearest support level.
Did you find this article helpful?
Your feedback helps us write better content.

Frequently Asked Questions
What is the evening star in candlestick patterns?
The Evening Star Pattern is a powerful bearish reversal signal that forms at the peak of an established uptrend. It is a three-candle formation that visually represents the shift from bullish momentum to bearish control.
How to confirm evening star pattern?
The pattern is confirmed by the third candle, but for a high-probability trade, you should look for confirmation on the fourth candle:
Close Below Day 3: The confirmation is strongest if the fourth candle closes lower than the low of the third bearish candle.
Penetration: The third candle should ideally close at least halfway down the body of the first bullish candle.
Volume: Look for high trading volume on the third bearish candle or the fourth confirmation candle, suggesting major institutional participation in the selling.
What is the success rate of the evening star pattern?
The exact statistical win rate of the Evening Star Pattern is highly variable and depends on the market, timeframe, and confirmation of rules used. However, it is generally considered a high-probability reversal pattern among three-candle formations.
Is the evening star bullish or bearish?
The Evening Star Pattern is bearish. Its entire purpose is to signal that the existing uptrend is exhausted, and that a price decline is imminent.
What are the best indicators to use with evening star?
The best indicators to confirm the bearish signal of the Evening Star and increase its reliability include:
Resistance Levels: The pattern should form exactly at a major resistance level, trendline, or key moving average.
Volume: High volume on the third bearish candle confirms the sellers’ conviction.
Momentum Oscillators: The pattern is stronger if a momentum indicator like the Relative Strength Index (RSI) or Stochastic Oscillator is registering an overbought signal (e.g., above 70 for RSI) when the pattern forms.
DISCLAIMER: Investment in securities market are subject to market risks, read all the related documents carefully before investing. The securities quoted are exemplary and are not recommendatory. Full disclaimer: https://bit.ly/naviadisclaimer.


