

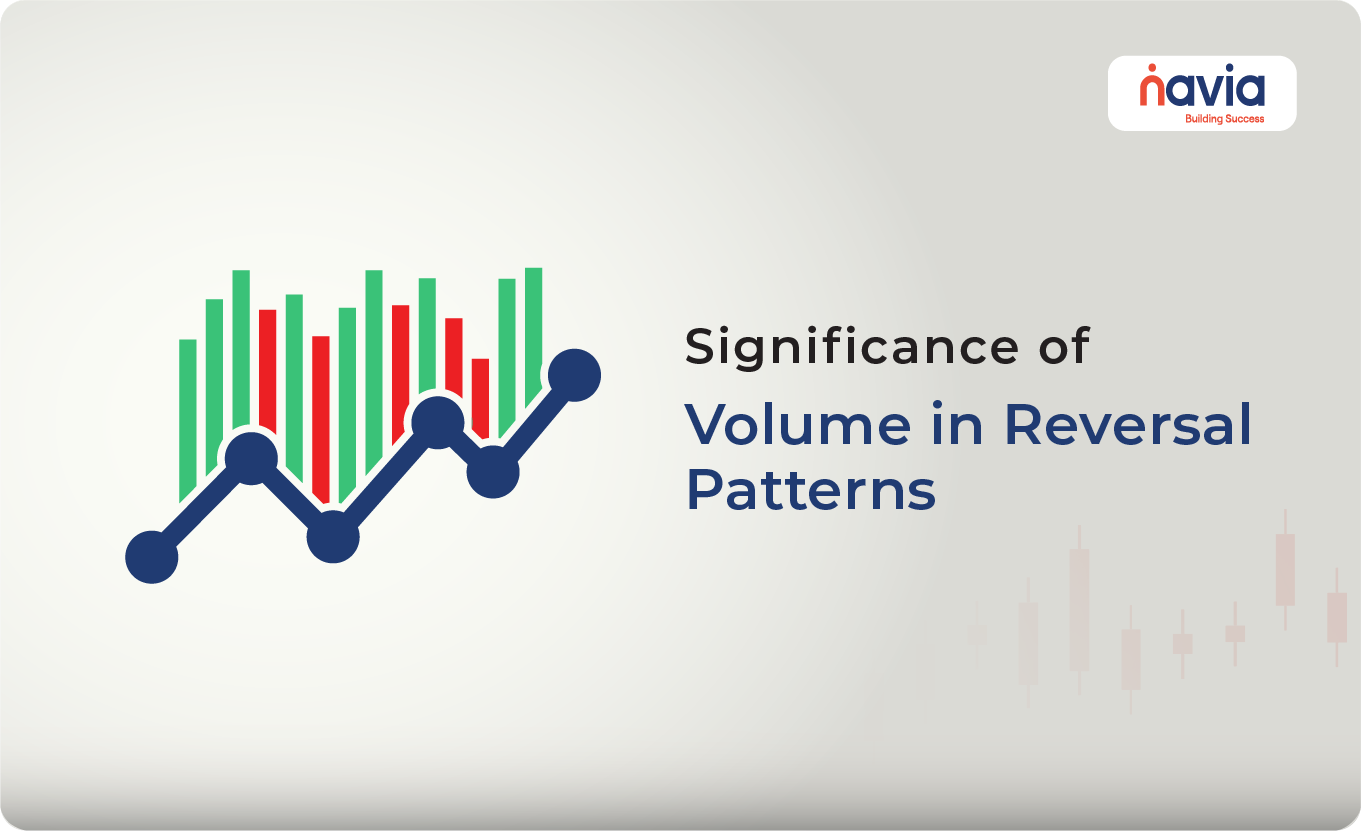
Significance of volume in reversal patterns?
The significance of volume in reversal patterns is critical for confirming the validity of these patterns and providing traders with insights into the strength or weakness of the impending reversal. Volume measures the number of shares or contracts traded in a specific time period and reflects the overall activity in a market. When it comes to reversal patterns, volume plays a key role in providing confirmation of trend changes.
Here are the reasons why volume is important in reversal patterns:
1. Volume Confirms the Strength of the Reversal
When a reversal pattern forms (such as Head and Shoulders, Double Top, or Double Bottom), the pattern alone doesn’t guarantee a trend change. The breakout or breakdown in price must be confirmed by an increase in volume. A significant spike in volume indicates that more market participants are involved in the trade, making the reversal more reliable.
🔸 In Bullish Reversals: A spike in volume at the point where the price breaks above a resistance level (in patterns like Double Bottom or Inverse Head and Shoulders) confirms that buyers are stepping in with strength.
🔸 In Bearish Reversals: A volume increase when the price breaks below a support level (in patterns like Head and Shoulders or Double Top) confirms that sellers are aggressively pushing the price lower.
Example:
In a Head and Shoulders pattern, when the price breaks below the neckline (a bearish signal), a volume surge confirms that the sellers are in control and that the trend is likely to reverse downward. Without an increase in volume, the breakdown could be a false signal.
2. Volume Decreases During the Formation of the Pattern
During the formation of reversal patterns, volume tends to decline, reflecting the indecision and consolidation that typically occurs before the trend reversal. This is common across most reversal patterns like the Double Top, Double Bottom, and Head and Shoulders patterns. As the price reaches a key support or resistance level multiple times, volume decreases because fewer market participants are confident about the prevailing trend continuing.
Decreasing Volume Indicates Weakening Trend:
As volume declines during the formation of the pattern, it signals that the trend is weakening, and a reversal could be on the horizon.
Example:
In a Double Top pattern, the volume tends to be higher during the first peak and lower during the second peak, indicating that the bullish momentum is weakening. The drop in volume suggests that fewer buyers are supporting higher prices, which can lead to a bearish reversal
3. Volume Confirms the Breakout or Breakdown
In reversal patterns, the breakout (upward or downward) is the key signal that the trend is changing direction. Volume acts as confirmation that the breakout is genuine.
🔸 Bullish Breakout: If a bullish reversal pattern (such as the Double Bottom or Inverse Head and Shoulders) forms, the volume should increase significantly as the price breaks above the neckline or resistance level. This indicates that buyers are stepping in with strength, increasing the likelihood of the price continuing to rise.
🔸 Bearish Breakdown: In bearish reversal patterns (such as the Head and Shoulders or Double Top), the volume should spike as the price breaks below the neckline or support level. A strong volume increase during the breakdown confirms that sellers are in control and the downtrend is likely to continue.
Example:
In a Double Bottom pattern, once the price breaks above the neckline (resistance level), an increase in volume confirms that buyers are pushing the price higher, validating the bullish reversal.
4. Low Volume Indicates Potential False Breakouts
If the price breaks out of a reversal pattern (either upward or downward) with low volume, it could indicate a false breakout. This means that the price might fail to follow through on the expected trend reversal and instead return to its previous trend.
🔸 Low Volume in Bullish Reversals: If a price breaks above resistance in a bullish reversal pattern with low volume, it could signal a lack of buyer participation, making the breakout less reliable.
🔸 Low Volume in Bearish Reversals: If a price breaks below support in a bearish reversal pattern with low volume, it could indicate a lack of seller strength, making the breakdown more likely to fail.
Example:
In a Rising Wedge pattern (a bearish reversal pattern), if the price breaks down below the lower trendline but volume remains low, there is a higher chance that the price could quickly reverse back into the wedge, indicating a false breakdown.
5. Divergence Between Price and Volume
Volume divergence can be a powerful signal of an impending reversal. This occurs when the price continues to make new highs or lows, but volume does not confirm the movement.
🔸 Bullish Divergence: In bullish reversal patterns like the Double Bottom, if the price is making lower lows, but volume is decreasing or showing bullish divergence (increasing volume while price falls), it may signal that the downtrend is losing strength and a reversal is near.
🔸 Bearish Divergence: In bearish reversal patterns like the Double Top, if the price is making higher highs but volume is decreasing, it may signal that the uptrend is weakening and a reversal could be imminent.
Example:
In a Double Bottom pattern, if the second bottom forms with lower price but higher volume compared to the first bottom, it signals bullish divergence, indicating a higher likelihood of a bullish reversal.
6. Volume Climax
A volume climax can occur during the final stage of a trend, signaling the last burst of momentum before the trend reverses. In a bearish reversal pattern, this could happen with a sharp increase in volume as sellers exhaust their strength, leading to a reversal in the opposite direction. Similarly, in a bullish reversal pattern, buyers could create a volume climax before the trend reverses downward.Example:
In a Rounding Top pattern, a volume climax could occur at the peak of the trend, where a sudden surge in volume indicates that the market has reached exhaustion, and the trend may soon reverse downward.

Summary of Volume’s Significance in Reversal Patterns
| Role of Volume | Description |
| Confirms the Strength of Reversal | A volume spike at the breakout confirms that the trend reversal is valid and supported by strong market participation. |
| Decreases During Formation | Volume often decreases during the formation of the pattern, signaling weakening momentum in the prevailing trend. |
| Confirms Breakouts/Breakdowns | A volume increase at the breakout (upward or downward) confirms the price movement and the validity of the reversal. |
| Low Volume Indicates False Breakouts | A breakout or breakdown without strong volume may indicate a false signal, suggesting the price could return to its previous trend. |
| Divergence Indicates Reversal | Price and volume divergence can signal that a trend reversal is likely, as volume fails to confirm the price movement. |
| Volume Climax Signals Exhaustion | A sudden spike in volume at the final stage of a trend can signal market exhaustion, indicating a potential reversal. |
Conclusion
Volume is a critical component of reversal patterns because it provides confirmation that the change in trend is supported by strong market participation. High volume during a breakout or breakdown confirms that the market agrees with the price movement, making the reversal more reliable. Conversely, low volume during a breakout can signal a false reversal, making it essential for traders to consider volume when interpreting reversal patterns.
In short, combining price action with volume analysis increases the likelihood of accurately identifying and trading reversal patterns, helping traders avoid false signals and improve their trading success.
Do You Find This Interesting?
We’d Love to Hear from you-

DISCLAIMER: Investments in the securities market are subject to market risks, read all the related documents carefully before investing. The securities quoted are exemplary and are not recommendatory. Brokerage will not exceed the SEBI prescribed limit.


