


Understanding the Double Top Pattern in Technical Analysis
- What is Double Top Pattern?
- Key Characteristics of the Double Top Pattern
- How to Identify Double Top Pattern
- Trading Double Top Pattern
- Entry Point
- Stop-Loss
- Target Price
- Numerical Example of a Double Top Pattern
- Significance of Volume in Double Top Pattern
- Example of a Double Top Pattern with Volume Spike
- When Does Double Top Pattern Occur?
- Trading Strategies for Double Top Patterns
- Conclusion
- Frequently Asked Questions
The Double Top Pattern is a well-known bearish reversal pattern used in technical analysis to signal a potential trend reversal from bullish to bearish. The pattern forms after an uptrend and consists of two peaks at roughly the same price level, indicating that buying momentum is weakening. Once the price breaks below the support level (called the neckline), it confirms the pattern and suggests that a downward trend is likely to follow.
In this article, we will explain the Double Top Pattern, how to identify it, its significance, and how to set target prices and stop-loss levels. We’ll also provide numerical examples to simplify its understanding.
💡 Quick Answer
A double top is a bearish reversal pattern that forms after a sustained uptrend. Price makes two peaks at roughly the same level, then breaks below the neckline, the support drawn across the low between them. That break confirms the reversal, and a volume spike on the breakout validates it.
What is Double Top Pattern?
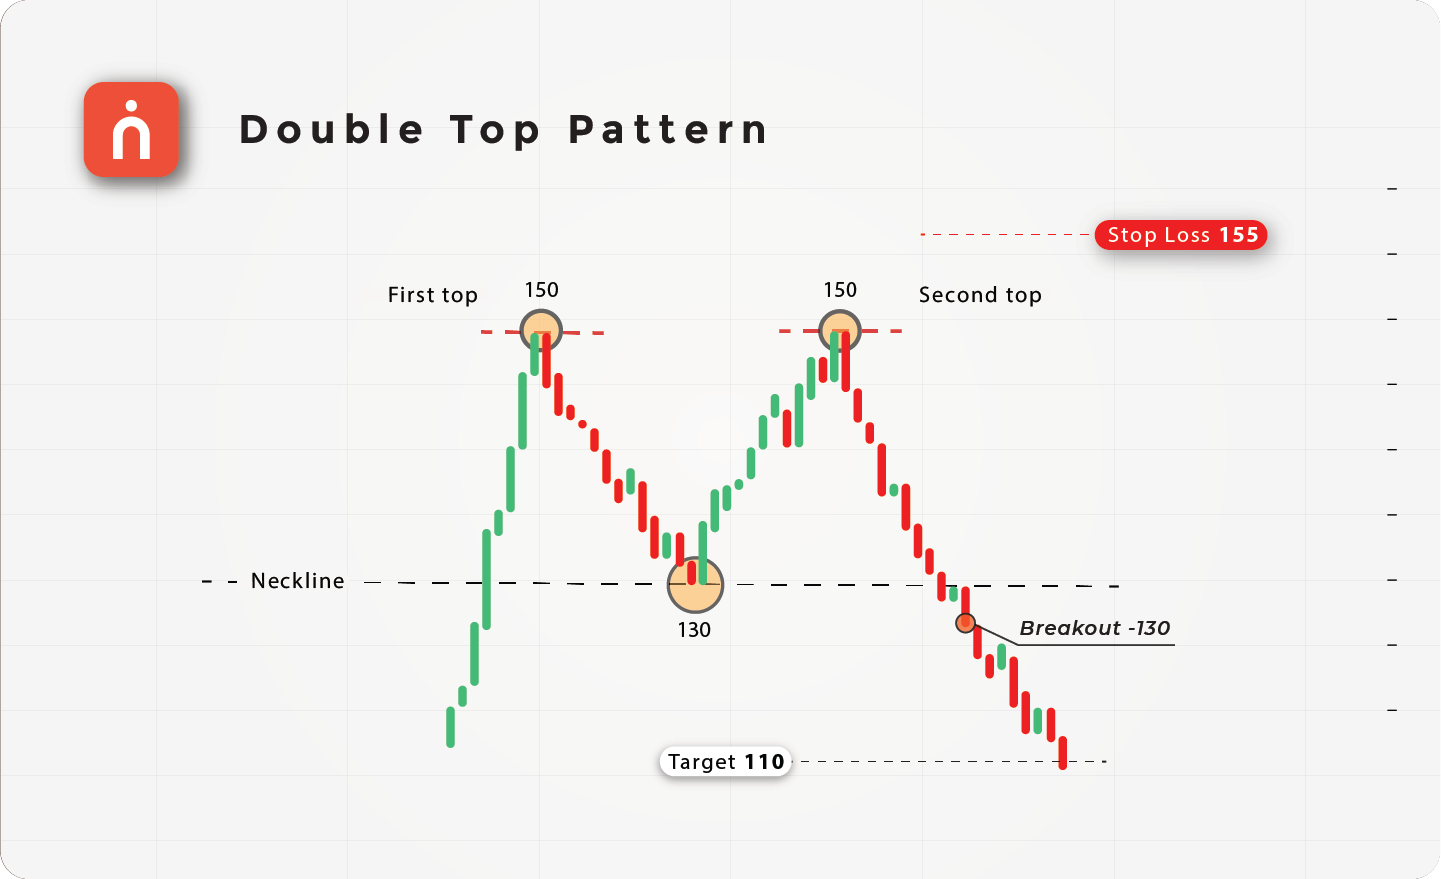
The Double Top Pattern forms after a sustained uptrend and is characterized by two distinct peaks at roughly the same price level. These two tops represent areas where the price has tested resistance and failed to break higher. The pattern is complete when the price breaks below the neckline, a support level connecting the intermediate low between the two peaks, signaling a bearish reversal.
Also Read: Flag Pattern Chart Analysis & Strategy
Key Characteristics of the Double Top Pattern
- Two Peaks:
The price forms two distinct tops at roughly the same price level, indicating strong resistance. These peaks show that buyers have attempted to push the price higher but failed twice. - Neckline (Support):
The neckline is drawn across the intermediate low between the two peaks. This horizontal or slightly upward-sloping line acts as a support level. A breakout below the neckline confirms the bearish reversal. - Volume:
Volume often decreases during the formation of the pattern and increases during the breakout below the neckline, confirming the reversal. - “M” Shape:
The pattern forms a distinctive “M” shape, where the two peaks represent the tops and the neckline serves as the support level.
How to Identify Double Top Pattern
- Identify Two Peaks:
Look for two consecutive peaks at roughly the same price level. These peaks should be spaced apart by a significant amount of time (days, weeks, or months). - Spot the Neckline:
Draw the neckline by connecting the low formed between the two peaks. This horizontal or slightly upward-sloping line acts as support. - Wait for the Breakout:
The pattern is confirmed when the price breaks below the neckline with strong volume, signaling a bearish reversal. - Measure the Target:
Measure the distance between the neckline and the highest point of the two tops, and project that distance downward from the neckline to set a target price.
Trading Double Top Pattern
Entry Point
Enter a short position when the price breaks below the neckline with significant volume, confirming the reversal.
Stop-Loss
Place your stop-loss just above the second top to protect against a potential false breakout.
Target Price
The target price is calculated by measuring the height of the pattern (the distance between the neckline and the two peaks) and projecting that distance downward from the breakout point.
Numerical Example of a Double Top Pattern
Let’s break down a simple example of a Double Top Pattern using numbers.
| Action | Price (₹) | Description |
|---|---|---|
| First Top | 150 | Price rises to ₹150, forming the first top |
| Intermediate Low | 130 | Price declines to ₹130, forming the neckline |
| Second Top | 150 | Price rises again to ₹150, forming the second top |
| Breakout | 130- | Price breaks below ₹130 with strong volume |
| Target Price | 110 | Target = ₹130 – (₹150 – ₹130) = ₹110 |
| Stop-Loss | 155 | Stop-loss placed just above the second top at ₹155 |
In this example, the price forms two consecutive tops at ₹150, and the neckline is drawn at ₹130, the low between the two tops. When the price breaks below ₹130, the target is calculated as ₹110, based on the height of the pattern (₹150 – ₹130 = ₹20). The stop-loss is placed just above the second top at ₹155 to protect against a false breakout.
Significance of Volume in Double Top Pattern
Volume is a key component in confirming the Double Top Pattern:
- Volume During the Pattern:
Volume typically decreases as the two tops form, reflecting weakening buying pressure. - Volume Spike at Breakout:
A volume spike during the breakout below the neckline confirms that the bearish reversal is valid. Without this increase in volume, the breakout might be a false signal. - Bearish Momentum:
A strong increase in volume during the breakout signals that sellers are taking control, and the downward move is likely to continue.
Example of a Double Top Pattern with Volume Spike
Here’s another example of a Double Top Pattern with volume:
| Action | Price (₹) | Volume | Description |
|---|---|---|---|
| First Top | 250 | 1,20,000 | Price rises to ₹250, forming the first top |
| Intermediate Low | 220 | 80,000 | Price declines to ₹220, forming the neckline |
| Second Top | 250 | 75,000 | Price rises again to ₹250, forming the second top |
| Breakout | 220- | 1,50,000 | Price breaks below ₹220 with a volume spike |
| Target Price | 190 | Target = ₹220 – (₹250 – ₹220) = ₹190 | |
| Stop-Loss | 255 | Stop-loss placed just above ₹250 |
In this example, the price forms two peaks at ₹250, with the neckline at ₹220. The price breaks below ₹220 with a volume spike (from 75,000 shares to 1,50,000 shares), confirming the bearish reversal. The target is set at ₹190, and the stop-loss is placed above ₹250 at ₹255.
When Does Double Top Pattern Occur?
The Double Top Pattern typically forms after a prolonged uptrend and signals that the bullish momentum is weakening. It occurs when the price tests a resistance level twice and fails to break higher, indicating that buyers are losing strength and sellers are taking control. This pattern is most effective when it forms over a longer time frame (weeks or months) and is confirmed by increasing volume during the breakout below the neckline.
Trading Strategies for Double Top Patterns
- In Bearish Markets:
The Double Top Pattern is a reversal signal, and traders can look for short-selling opportunities when the price breaks below the neckline support level. - Volume-Based Confirmation:
A volume spike during the breakout confirms the strength of the bearish reversal. If the breakout occurs on low volume, it may be a false breakout. - Target and Stop-Loss Setting:
Use the height of the pattern to set a realistic target price, and place your stop-loss just above the second top to manage risk.

Conclusion
The Double Top Pattern is a reliable bearish reversal pattern that signals the potential end of an uptrend and the beginning of a downtrend. By identifying the two peaks, drawing the neckline, and waiting for a volume-confirmed breakout, traders can capitalize on the reversal.
With clear entry points, stop-loss levels, and target prices, the Double Top Pattern provides a structured and relatively low-risk strategy for traders looking to profit from bearish market reversals. By paying attention to volume spikes during the breakout, traders can confirm the validity of the pattern and avoid false signals.
Key Takeaways
- The double top forms after a sustained uptrend and is made of two distinct peaks at roughly the same price level, giving the pattern its distinctive “M” shape.
- The neckline is the support level drawn across the intermediate low between the two peaks. The pattern is only complete once price breaks below it.
- Volume typically decreases as the two tops form and spikes on the break below the neckline; without that increase, the breakout may be a false signal.
- Set the target by measuring the distance between the neckline and the peaks and projecting it downward from the breakout point; place the stop-loss just above the second top.
- The double top is the two-peak version of the triple top and the bearish mirror of the triple bottom, both of which use the same neckline logic, while the engulfing pattern gives the same reversal warning in just two candles. All of them are read on the charts covered in our guide to candlestick patterns.
Frequently Asked Questions
What is a double top pattern?
A double top pattern is a bearish reversal chart pattern that forms after a sustained uptrend. It is characterized by two distinct peaks at roughly the same price level, separated by a moderate trough. The pattern signals a potential trend reversal from bullish to bearish once the support level at the trough is broken.
How do traders identify a double top pattern?
Traders look for two consecutive peaks at a similar resistance level, with a pullback in between. The pattern is confirmed when the price falls below the “neckline” (the lowest point between the tops), indicating sellers are in control and a potential downward trend may follow.
What does the double top pattern indicate in trading?
The double top pattern indicates that buying pressure is waning and sellers are gaining strength. It’s often seen as a warning of a reversal, signaling traders to consider selling or avoiding long positions in the asset.
How can I trade using the double top pattern?
Confirm the pattern with volume and price action after the second top.
Enter a sell (short) position when the price closes below the neckline.
Set a stop-loss slightly above the second peak.
Target profit by measuring the distance from the neckline to the peaks and projecting that down from the neckline.
What are common mistakes to avoid with double top patterns?
Acting before the neckline is broken (pattern may fail if not confirmed).
Ignoring trading volume (low volume can result in false breakouts).
Not setting stop-losses, which exposes you to larger losses if the reversal does not play out.
Do You Find This Interesting?
We’d Love to Hear from you-

DISCLAIMER: Investments in the securities market are subject to market risks, read all the related documents carefully before investing. The securities quoted are exemplary and are not recommendatory. Brokerage will not exceed the SEBI prescribed limit. Full disclaimer: https://bit.ly/naviadisclaimer


