Navia Weekly Roundup (Apr 20- Apr 24, 2026)
- Week in the Review
- Indices Analysis
- Interactive Zone!
- Sector Spotlight
- Top Gainers and Losers
- Currency Chronicles
- Commodity Corner
- Top Blogs of the Week!
- N Coins Rewards
Week in the Review
Indian equity markets snapped their two-week winning streak, with the Nifty 50 declining for the week ended April 24 and slipping below the 24,000 mark. The decline was driven by a combination of global and domestic headwinds, including uncertainty around US–Iran negotiations, which pushed crude oil prices higher, along with persistent foreign institutional investor (FII) outflows and a weakening rupee added to the pressure on markets. Weakness in IT stocks following mixed earnings further dampened sentiment.
Indices Analysis
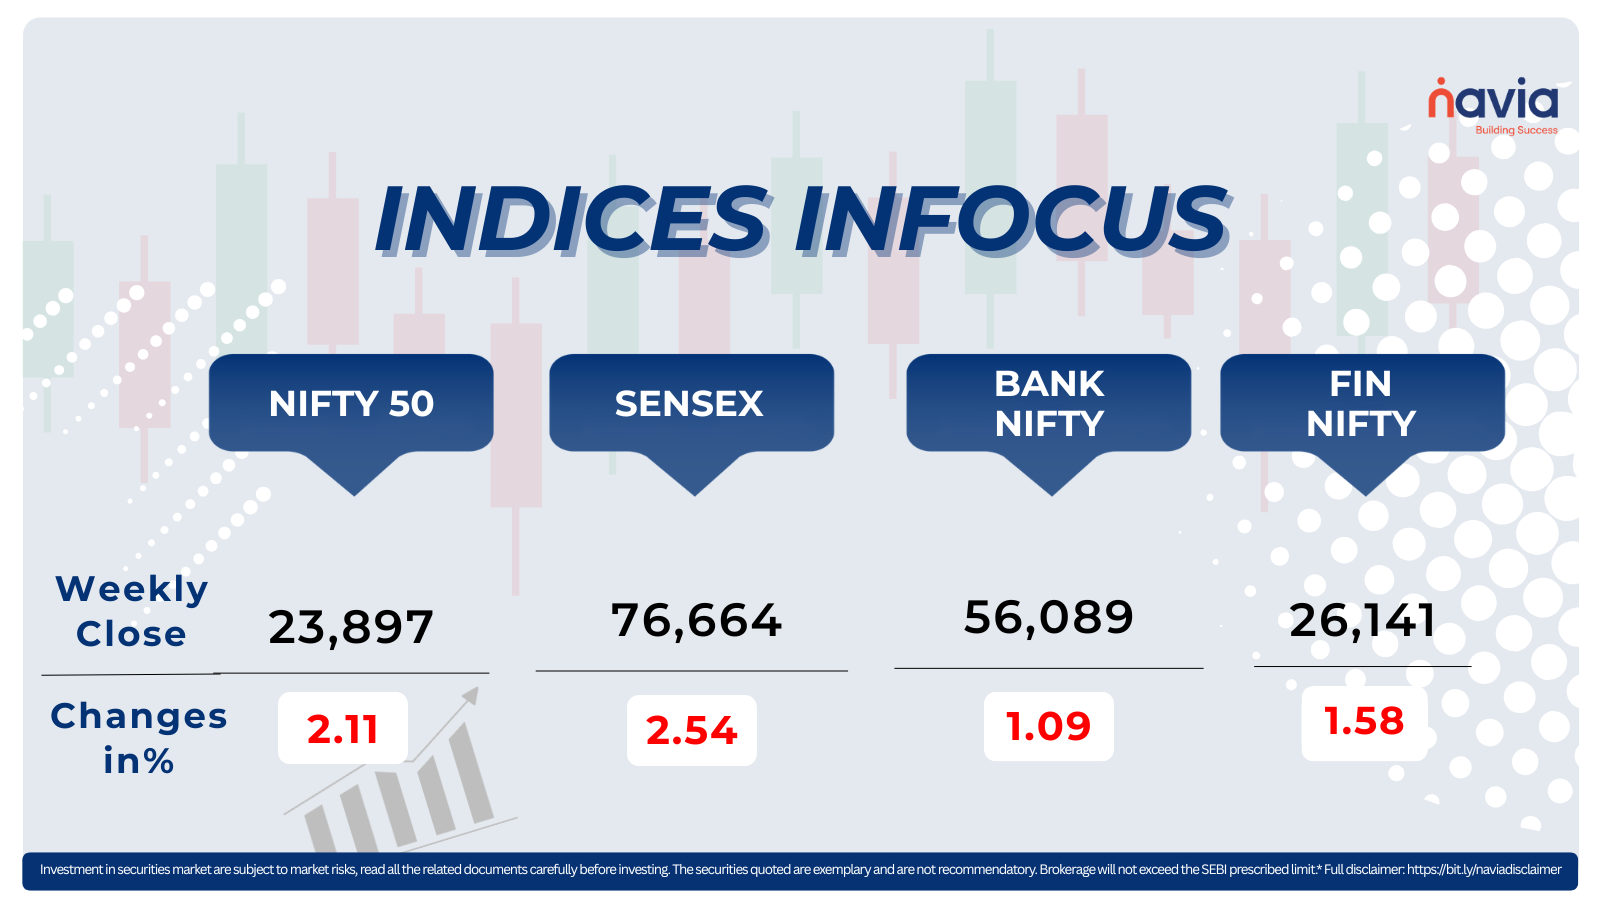
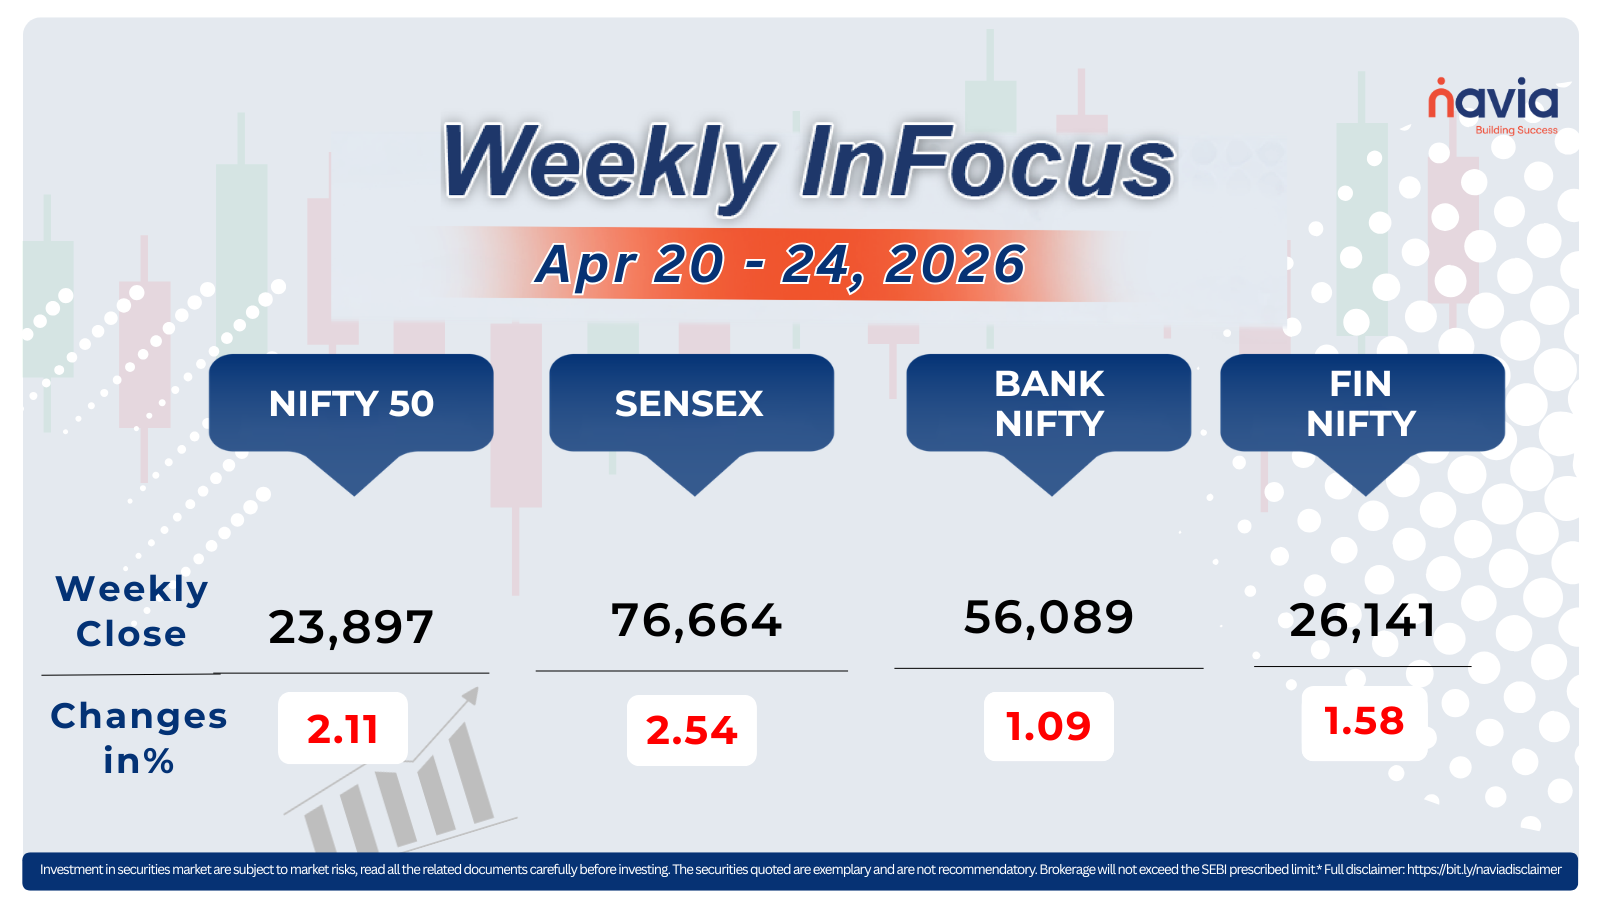
For the week, the BSE Sensex declined by 2.54%, to close at 76,664, while the Nifty 50 fell 2.11%, to settle at 23,897.95.
The Nifty Midcap 100 index declined 0.8% during the week. Key laggards included Persistent Systems, Coforge, Mphasis, Tata Elxsi, 360 ONE WAM, Info Edge India, ICICI Lombard General Insurance Company, and Alkem Laboratories. On the other hand, gainers in the midcap space included Oracle Financial Services Software, Hitachi Energy India, GE Vernova T&D India, Billionbrains Garage Ventures, AU Small Finance Bank, Housing & Urban Development Corporation, and Jubilant FoodWorks.
The Nifty Smallcap index ended the week on a flat note. Key laggards included Firstsource Solutions, Ola Electric Mobility, IIFL Finance, Zensar Technologies, Anant Raj, Gujarat Mineral Development Corporation, and Force Motors. On the other hand, several stocks delivered strong gains, with Data Patterns (India), Himadri Speciality Chemical, Amara Raja Energy & Mobility, Welspun Corp, PNB Housing Finance, Piramal Finance, Piramal Pharma, Triveni Turbine, and Meesho rallying in the range of 10–16%.
The total market capitalisation of BSE-listed companies declined by over Rs 4 lakh crore during the week, with HCL Technologies witnessing the sharpest erosion, followed by Infosys, Tech Mahindra, and Tata Consultancy Services. In contrast, Trent, Hindustan Unilever, and NTPC saw gains in their market capitalisation.
Foreign Institutional Investors (FIIs) remained net sellers throughout the week, offloading equities worth Rs 17,139.86 crore. In contrast, Domestic Institutional Investors (DIIs) emerged as net buyers, purchasing equities worth Rs 9,782.05 crore during the same period.
Interactive Zone!
Test your knowledge with our Markets Quiz! React to the options and see how your answer stacks up against others. Ready to take a guess?
Sector Spotlight
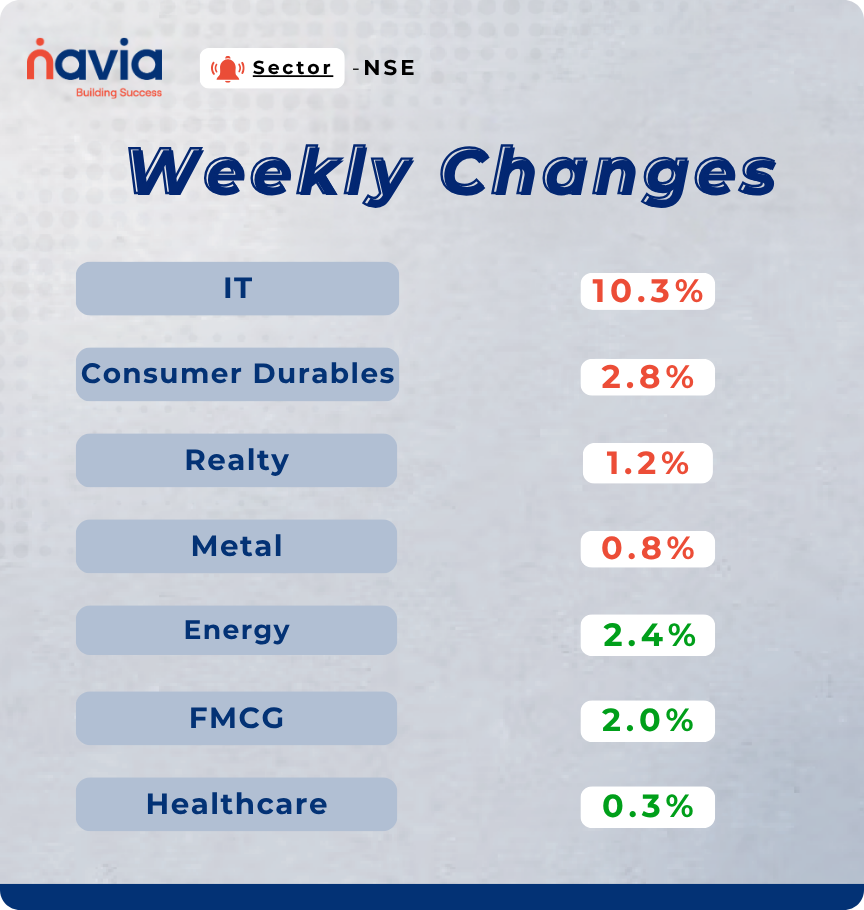
A mixed trend was observed across sectors during the week, with the Nifty IT index plunging 10.3%, marking its steepest weekly decline since March 2020. Nifty Consumer Durables, Nifty Realty, and Nifty Metal also ended lower, declining in the range of 2-0.8%. On the positive side, Nifty Energy, Nifty FMCG, and Nifty Healthcare indices posting gains of 0.3% to 2.4% for the week.
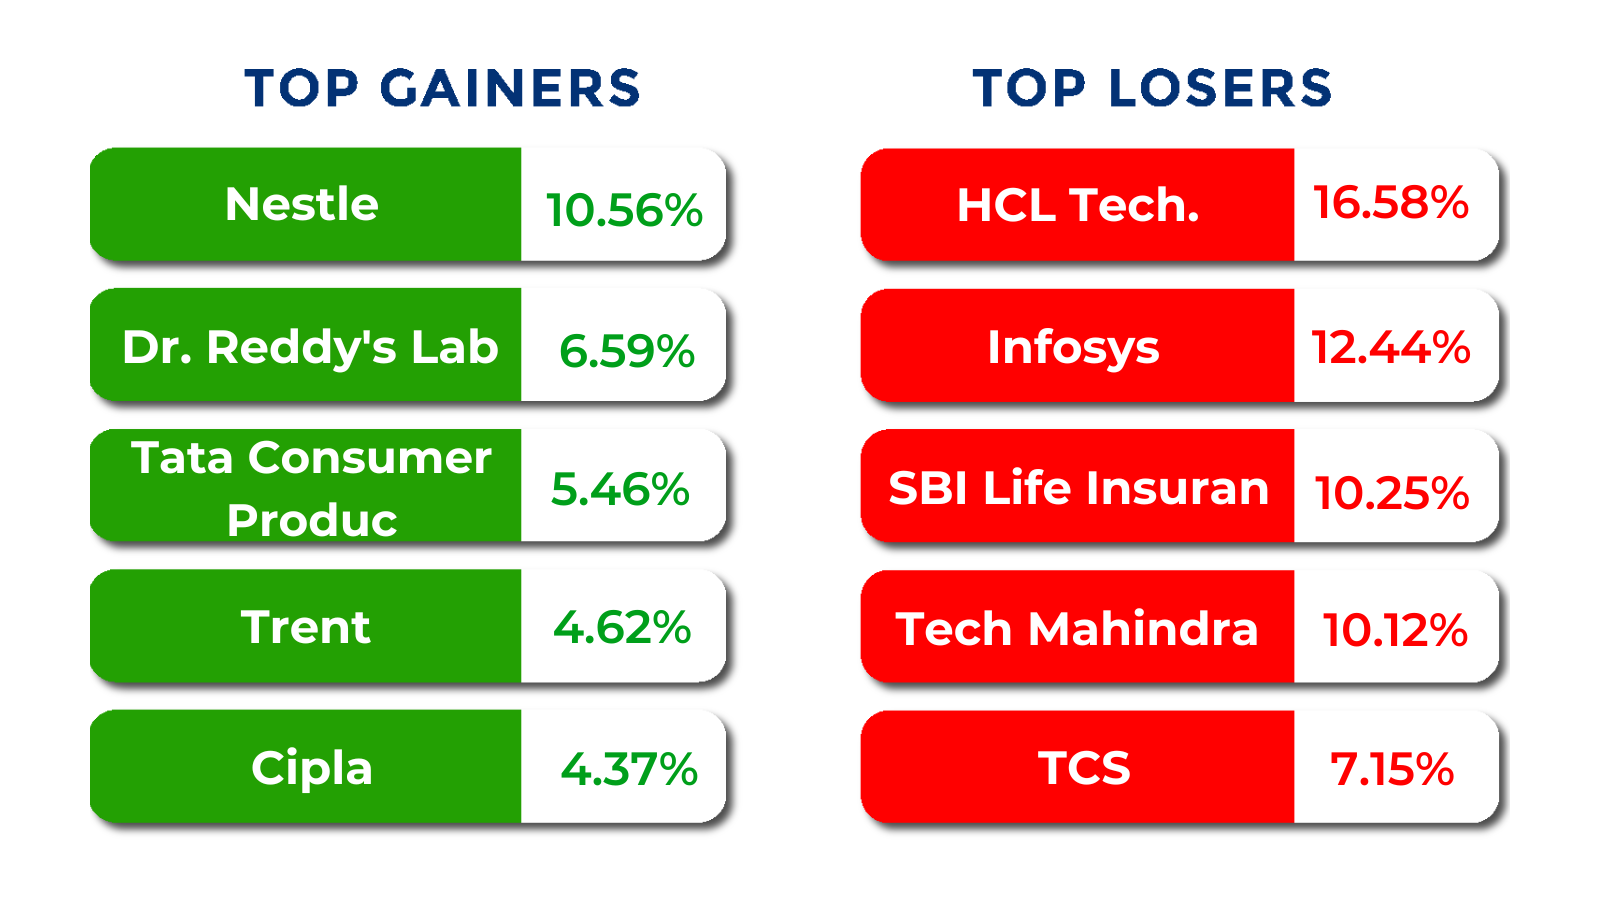
Top Gainers and Losers
Currency Chronicles
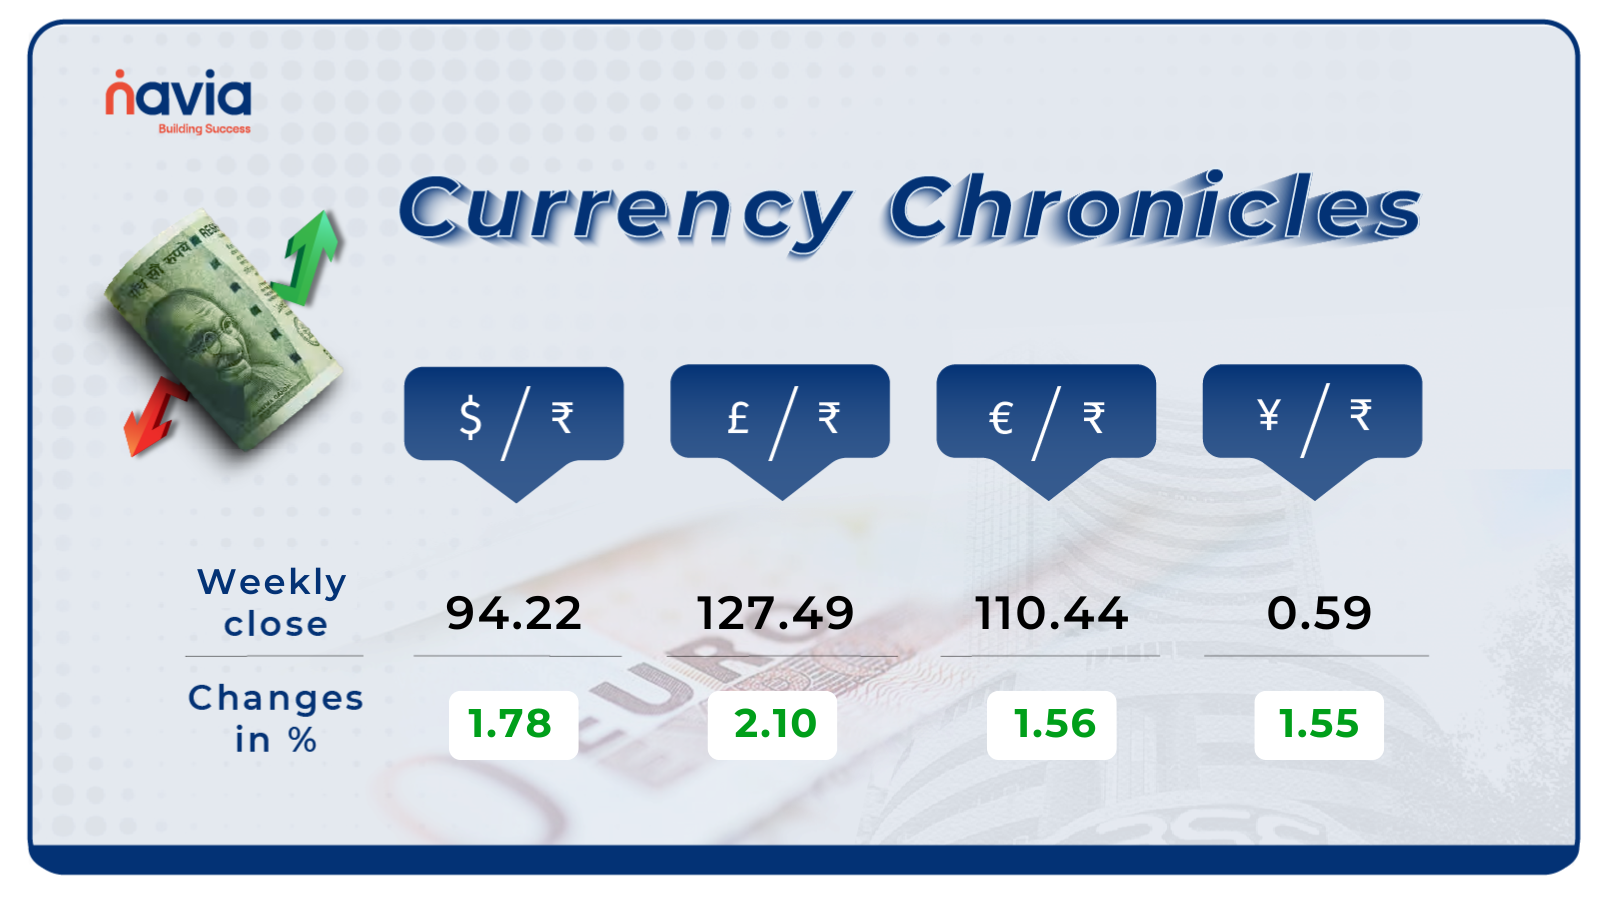
USD/INR:
The USD/INR rate closed at ₹94.22 per dollar, gaining 1.78% during the week, reflecting a bullish market sentiment.
EUR/INR:
The EUR/INR rate closed at ₹110.44 per euro, gaining 1.56% during the week, reflecting a bullish market sentiment.
JPY/INR:
The JPY/INR rate closed at ₹0.59 per yen, gaining 1.55% during the week, reflecting a bullish market sentiment.
Stay tuned for more currency insights next week!
Commodity Corner
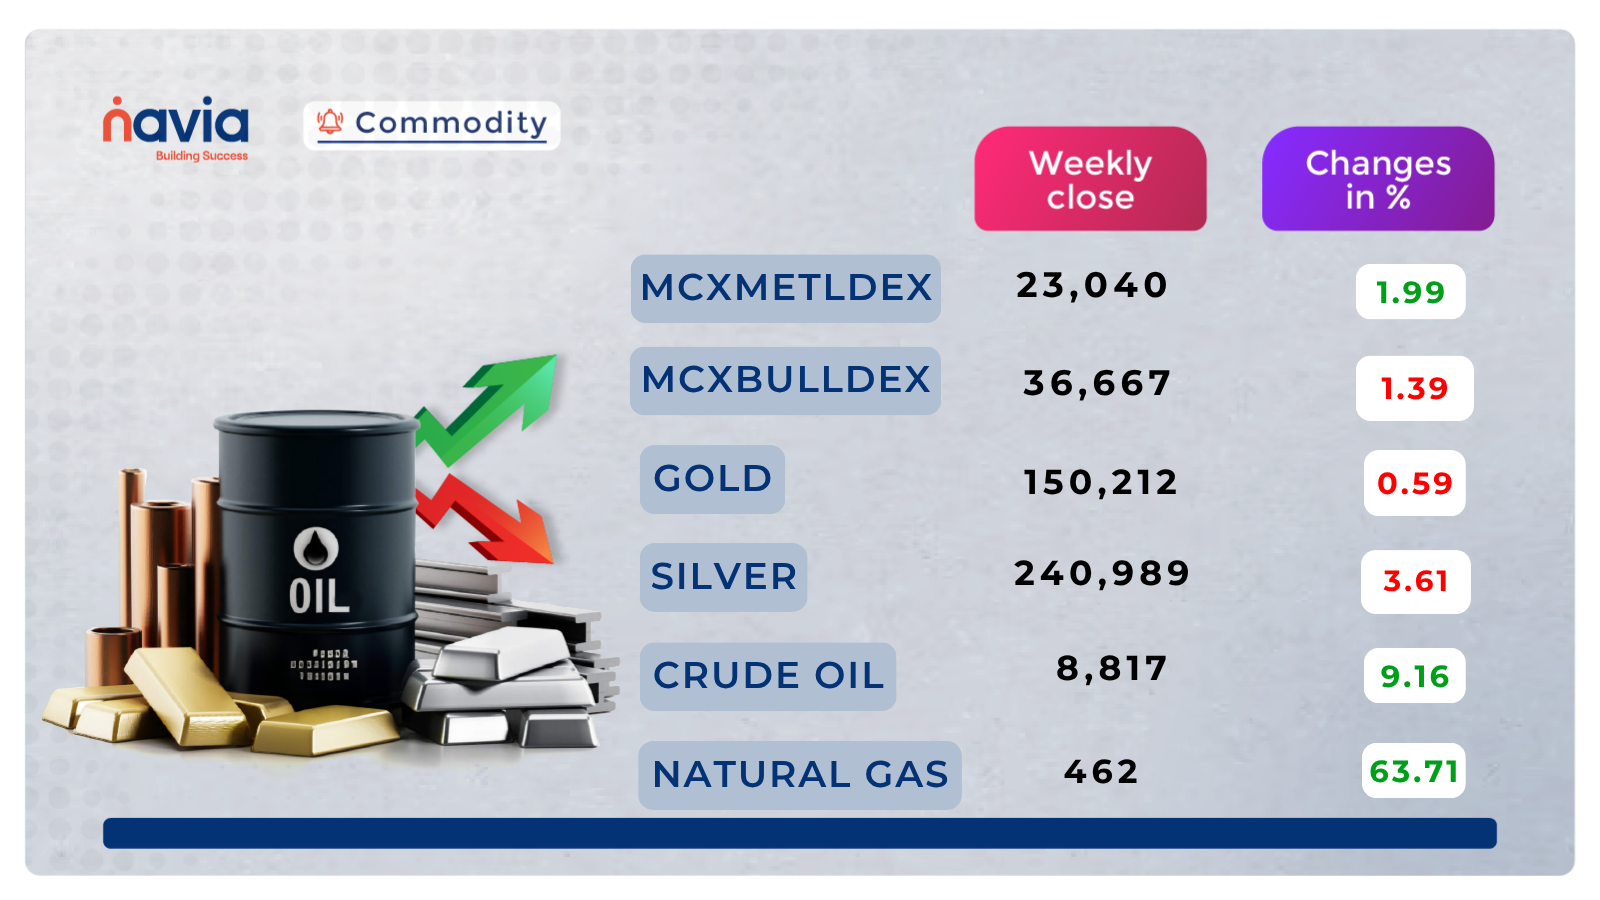
Crude Oil futures are currently showing strong bullish momentum with a prominent green candle extending sharply from the prior session’s recovery base. The price has staged a decisive move higher from the demand zone near 8,124 and is now approaching the key overhead resistance band near 9,250, with buyer conviction firmly established and momentum strongly favoring continuation of the recovery rally.
The broader structure has shifted constructively bullish, with the price building a clear series of higher lows from the corrective lows near 7,700 and recovering strongly toward key structural resistance levels. The current zone near 9,000–9,100 reflects strong buyer control and accelerating upside momentum following the sustained base-building phase. A sustained trade above 9,250 would confirm the next leg of the bullish advance and invite upside momentum toward 9,300 and 9,350, validating the full recovery from the corrective phase.
On the downside, immediate support lies near 8,940, followed by stronger structural demand near 8,730. A breakdown below 8,940 may invite short-term corrective pressure, though the dominant near-term bias firmly favors buyers on dips as long as price holds above key structural support levels.
Gold futures are showing a mild red candle with continued weakness below the key overhead resistance band near 153,500–154,900. The price has been unable to sustain meaningful recovery attempts and continues to trade beneath prior support-turned-resistance levels, with sellers asserting consistent control and the near-term structure reflecting distribution following the extended rejection from higher levels.
The broader near-term bias remains bearish, with the price trading below the key resistance band and each attempted recovery being met with renewed selling pressure at higher levels. The current zone near 151,500–152,500 represents a critical near-term juncture, with the price at risk of a decisive break below the key structural support zone. A sustained trade below 151,000 would confirm renewed bearish momentum and invite downside pressure toward 149,500 and 148,000.
On the upside, a decisive breakout and sustained close above 153,500 would be required to shift the near-term bias constructively and neutralise the current distribution pattern, though the prevailing structure firmly favours sellers near resistance unless a clear and sustained close above the overhead supply band materialises.
Natural Gas futures are showing a sharp corrective red candle following the prior session’s advance toward the 257–258 resistance zone. Despite today’s pullback, the broader recovery structure from the multi-week lows near 241 remains intact, with the price continuing to build higher lows and the overall near-term bias favouring buyers on dips following the sustained recovery from lower levels.
The broader structure remains constructively bullish, with the price holding well above the corrective lows and the recovery trend continuing to define the dominant near-term direction. The current pullback toward the 244–246 zone represents a natural corrective retracement within the broader recovery move, offering a potential re-entry opportunity for buyers. A sustained trade above 246 would confirm the resumption of the recovery and invite upside momentum toward 248 and 250.
On the downside, immediate support lies near 240, followed by stronger demand near 237. A breakdown below 240 would signal a deeper corrective phase and delay the recovery, though the prevailing bullish structure strongly favours buyers on dips as long as price holds above the key 240 demand zone.
Silver Futures are currently showing continued bearish pressure with a red candle extending the multi-session decline from the highs near 261,000. The price has broken decisively below the key support zones and is now trading well beneath the overhead supply band, with seller dominance firmly established and the short-term structure reflecting sustained distribution following the sharp reversal from elevated levels.
The broader near-term bias remains firmly bearish, with the price printing consistent lower highs and lower lows following the rejection from the 261,000 resistance zone. The current zone near 241,500–243,000 offers limited buyer support, and the sustained weakness below the 245,000 level confirms seller control across sessions. A decisive breakdown below 239,500 would confirm renewed bearish momentum and invite corrective extension toward 237,500 and 235,500.
On the upside, a sustained breakout above 245,000 would be required to neutralise the current bearish bias and invite a short-term relief bounce, though the prevailing structure and momentum firmly favour sellers unless a decisive and sustained close above overhead supply materialises.
Do you have a question? Ask here and we’ll publish the information in the coming weeks.
Top Blogs of the Week!

Sortino Ratio: Meaning, Formula, and Why it Matters in Mutual Funds
In mutual fund investing, evaluating a fund based on returns alone is only half the story. The other half is the risk taken to achieve those returns. This is where the Sortino Ratio becomes an essential tool. It helps investors understand the fund’s risk-adjusted performance by focusing specifically on downside risk.

Dow Theory: Definition, Principles, and Its Use in Technical Analysis
The Dow Theory is one of the oldest and most respected frameworks in market analysis. Developed from the observations of Charles Dow-the founder of the Wall Street Journal-it provides a structured way to identify market direction, trend health, and potential reversals.
N Coins Rewards

Refer your Friends & Family and GET 500 N Coins.
Do You Find This Interesting?

DISCLAIMER: Investment in securities market are subject to market risks, read all the related documents carefully before investing. The securities quoted are exemplary and are not recommendatory. Full disclaimer: https://bit.ly/naviadisclaimer.