Navia Weekly Roundup (May 25- 29, 2026)
Week in the Review
In the holiday-shortened week, Indian equity markets ended on a subdued note amid heightened volatility, weighed down by persistent foreign fund outflows and profit booking in heavyweight stocks. Investor sentiment remained cautious amid uncertainty surrounding the ongoing negotiations between the U.S. and Iran.
Indices Analysis
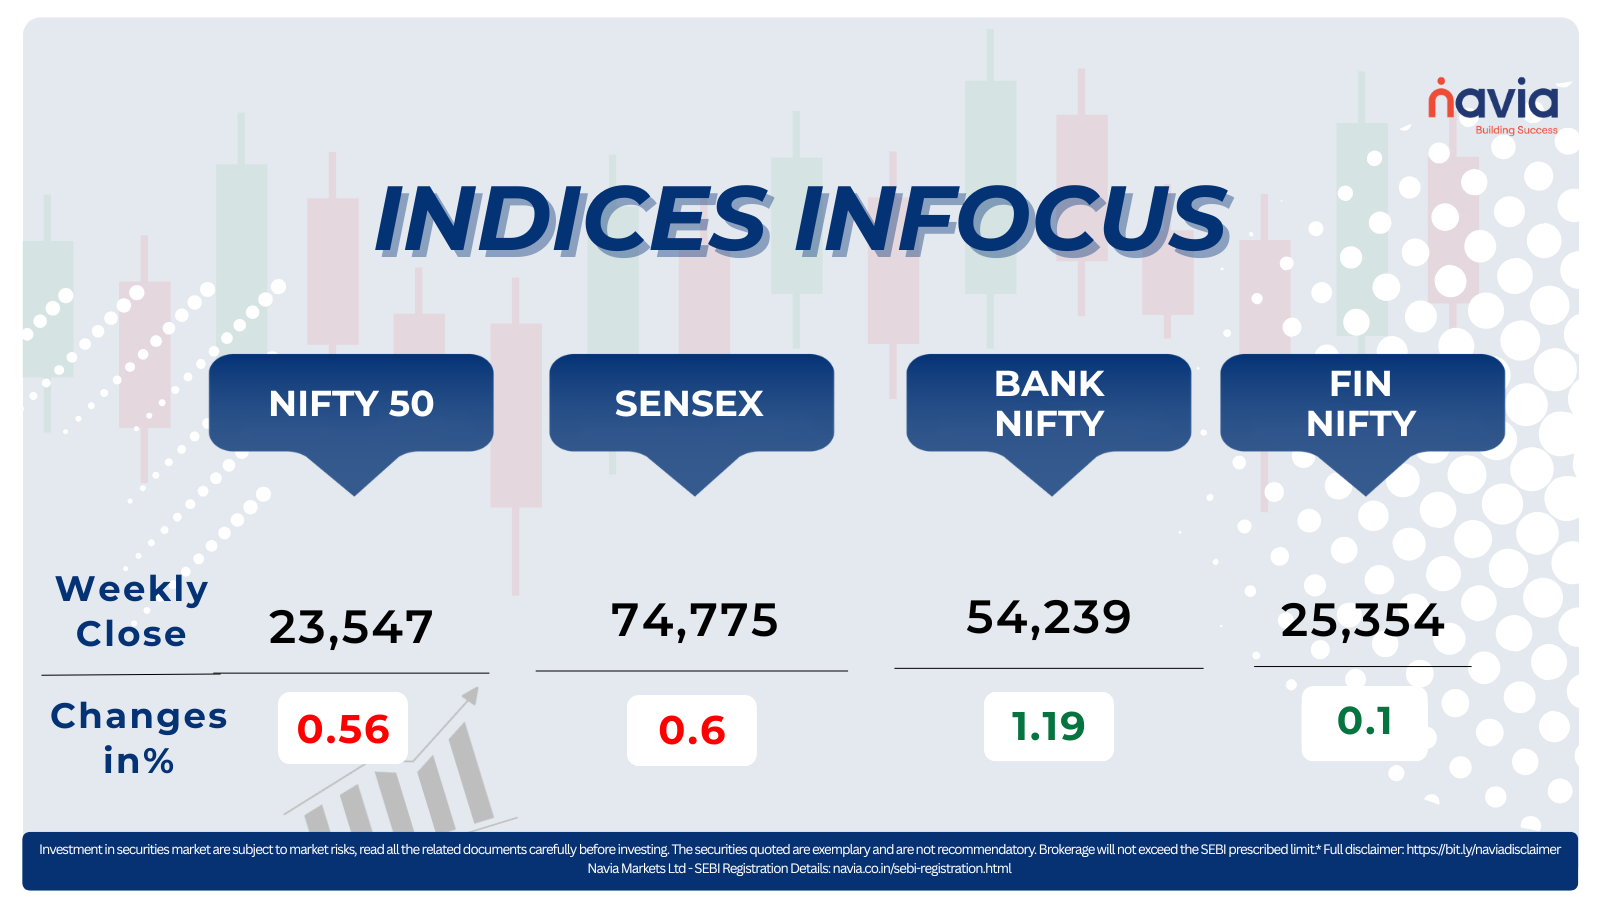
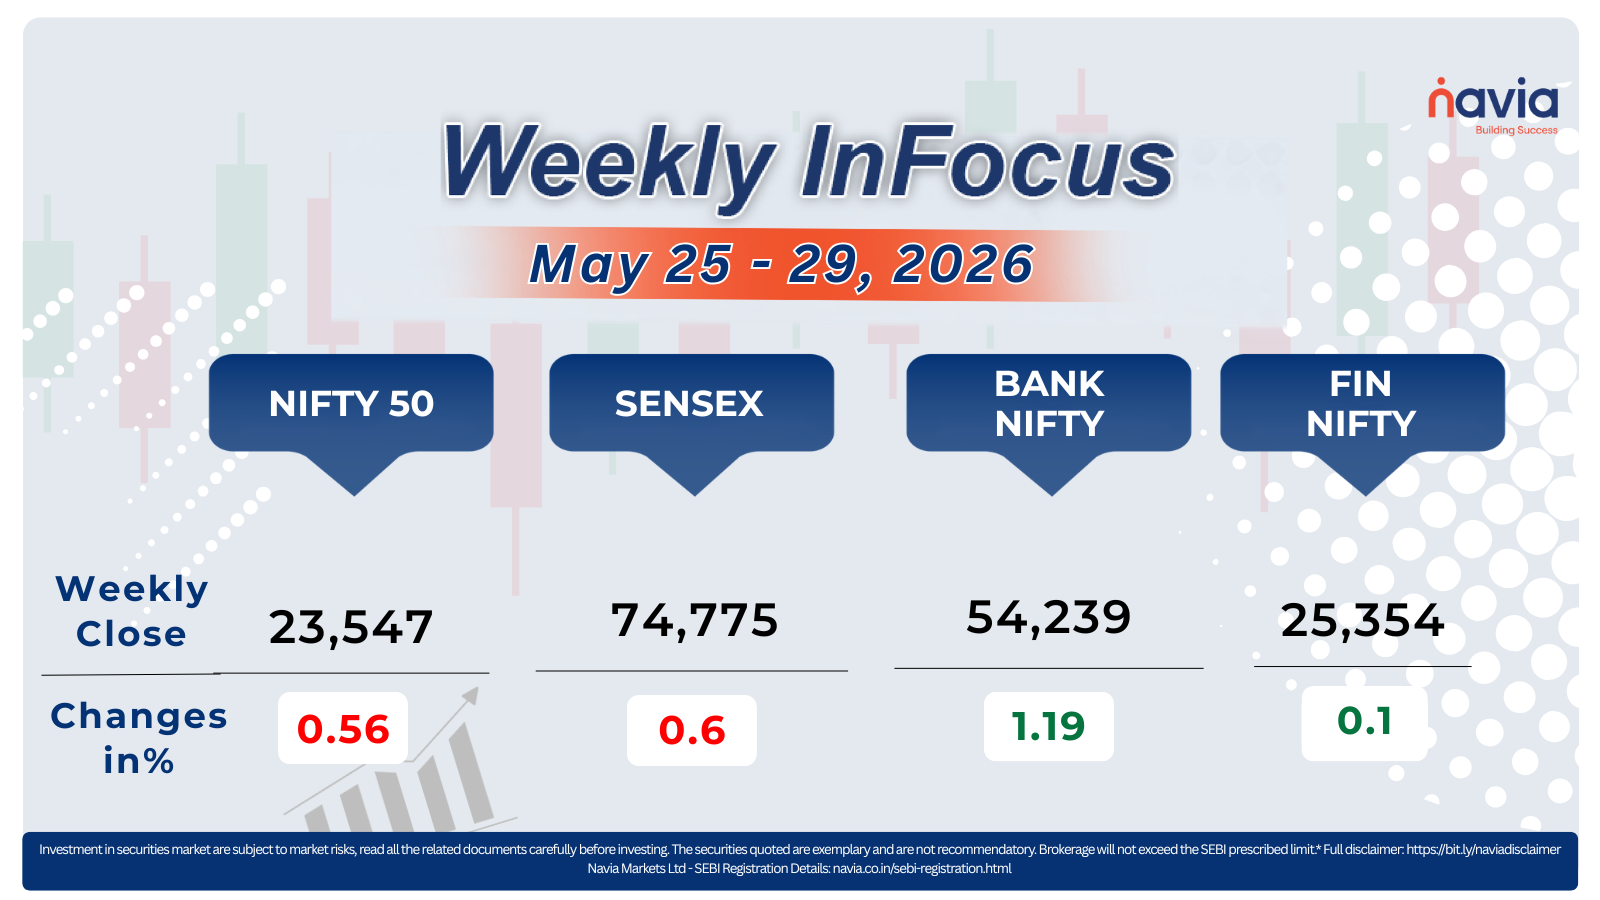
For the week, the BSE Sesnex declined 0.6 percent, to close at 74,775.74, while the Nifty 50 fell 0.56 percent, to settle at 23,547.75.
The Nifty Midcap 100 index extended its winning streak for the second consecutive week, gaining 0.5 percent and touching a fresh record high during the period. Among the top performers in the index were Adani Total Gas, Exide Industries, ICICI Prudential Asset Management Company, Hitachi Energy India, JSW Energy, and Premier Energies. On the other hand, laggards included Multi Commodity Exchange of India, Rail Vikas Nigam, Container Corporation of India, Bharat Dynamics, FSN E-Commerce Ventures, and PB Fintech.
The Nifty Smallcap 100 index also extended its winning streak for the second consecutive week, advancing 1 percent during the period. Among the top gainers were Wockhardt, Netweb Technologies India, Ola Electric Mobility, Afcons Infrastructure, and IFCI, which rallied between 12 percent and 28 percent during the week. On the downside, Great Eastern Shipping Company, Natco Pharma, Jyoti CNC Automation, Sarda Energy and Minerals, Meesho, JSW Cement, and BEML were among the major laggards, declining between 6 percent and 15 percent.
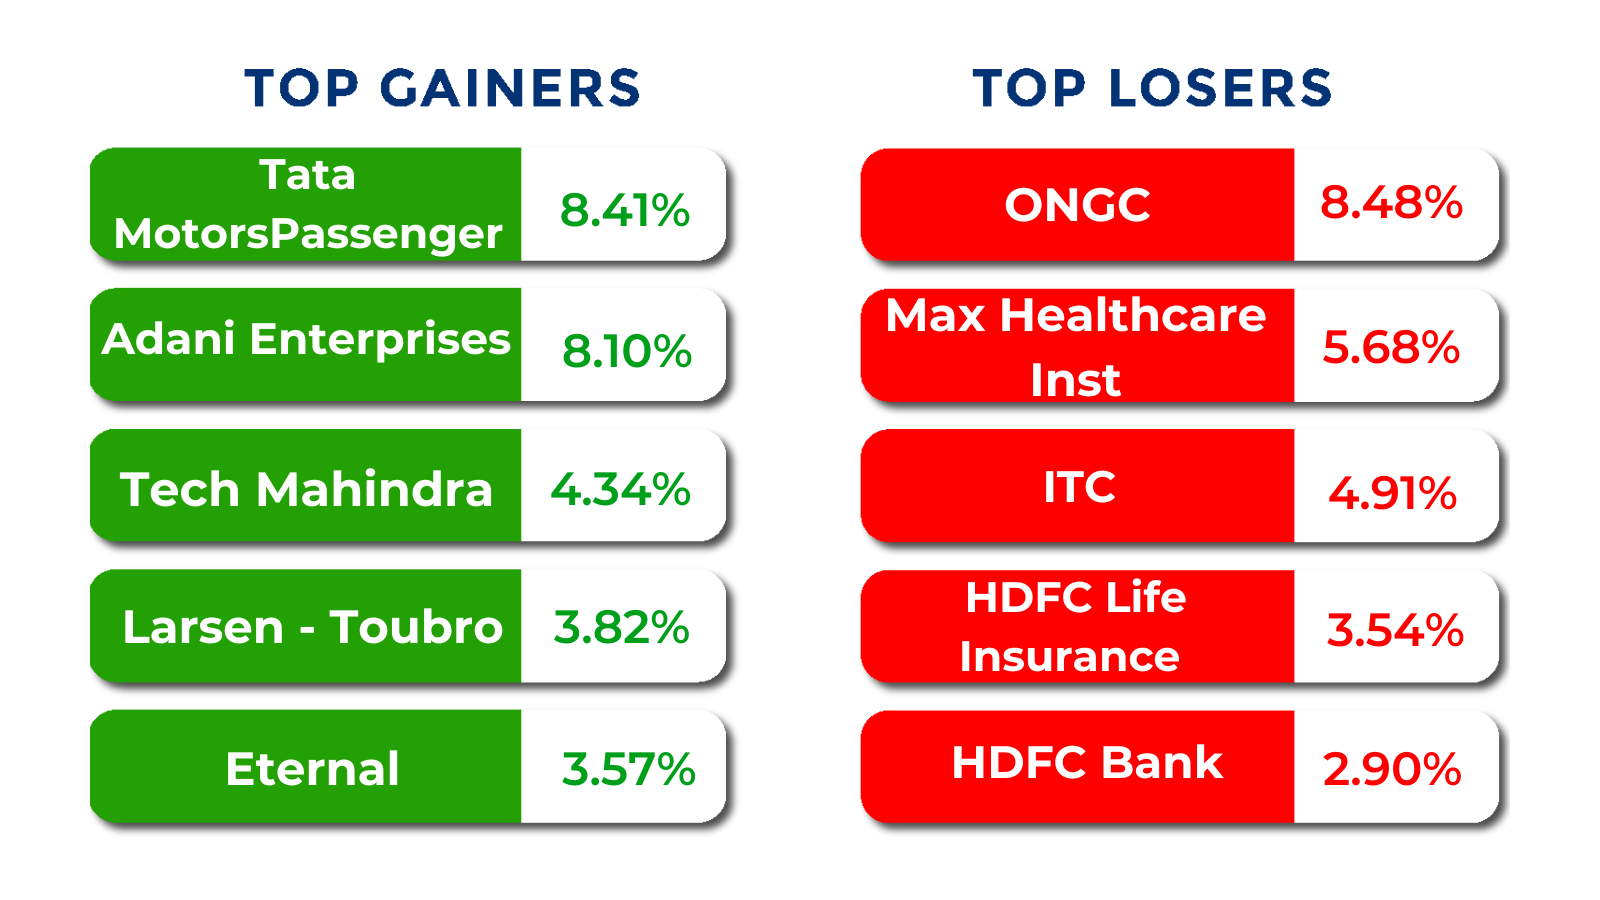
The total market capitalisation of companies listed on the BSE increased by more than Rs 2 lakh crore during the week. Among the top contributors to the rise in market value were Larsen & Toubro, followed by State Bank of India, Eternal, and Tech Mahindra. On the other hand, Reliance Industries, HDFC Bank, and Bharti Airtel witnessed a decline in their market capitalisation during the same period.
During the week, Domestic Institutional Investors (DIIs) maintained their buying momentum, purchasing equities worth Rs 25,803.45 crore. Meanwhile, Foreign Institutional Investors (FIIs) remained net sellers, offloading equities worth Rs 23,734.68 crore.
Interactive Zone!
Test your knowledge with our Markets Quiz! React to the options and see how your answer stacks up against others. Ready to take a guess?
Sector Spotlight
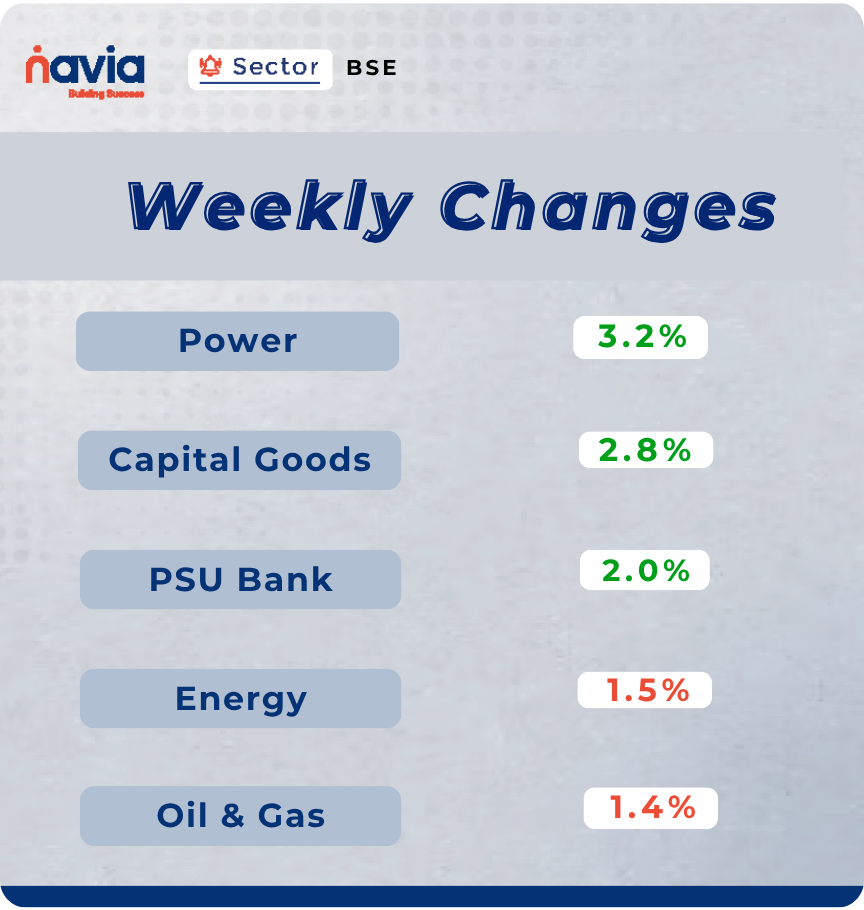
Sectoral indices ended on a mixed note during the week. The BSE Power, BSE Capital Goods, and BSE PSU Bank indices were among the top gainers, rising 2–3 percent each. On the other hand, the BSE Energy and Oil & Gas indices declined 1–1.5 percent each.
Top Gainers and Losers
Currency Chronicles
USD/INR:
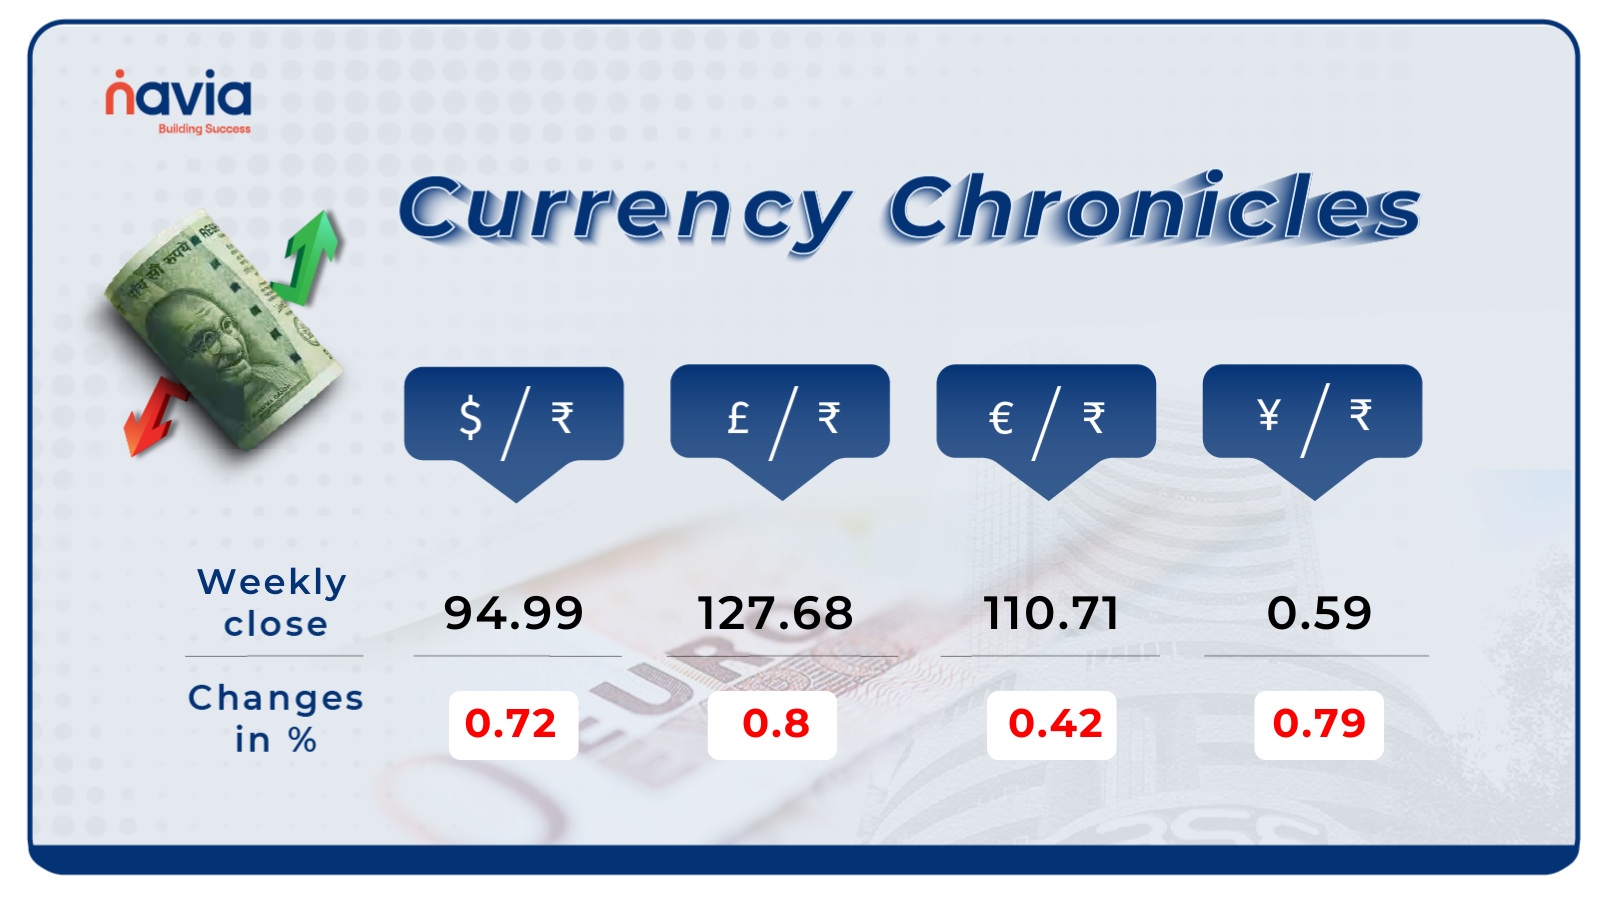
The USD/INR rate closed at ₹94.99 per dollar, down 0.72% for the week, reflecting bearish market sentiment.
EUR/INR:
The EUR/INR rate closed at ₹110.71 per euro, down 0.42% for the week, reflecting bearish market sentiment.
JPY/INR:
The JPY/INR rate closed at ₹0.59 per yen, down 0.79% for the week, reflecting bearish market sentiment.
Stay tuned for more currency insights next week!
Commodity Corner
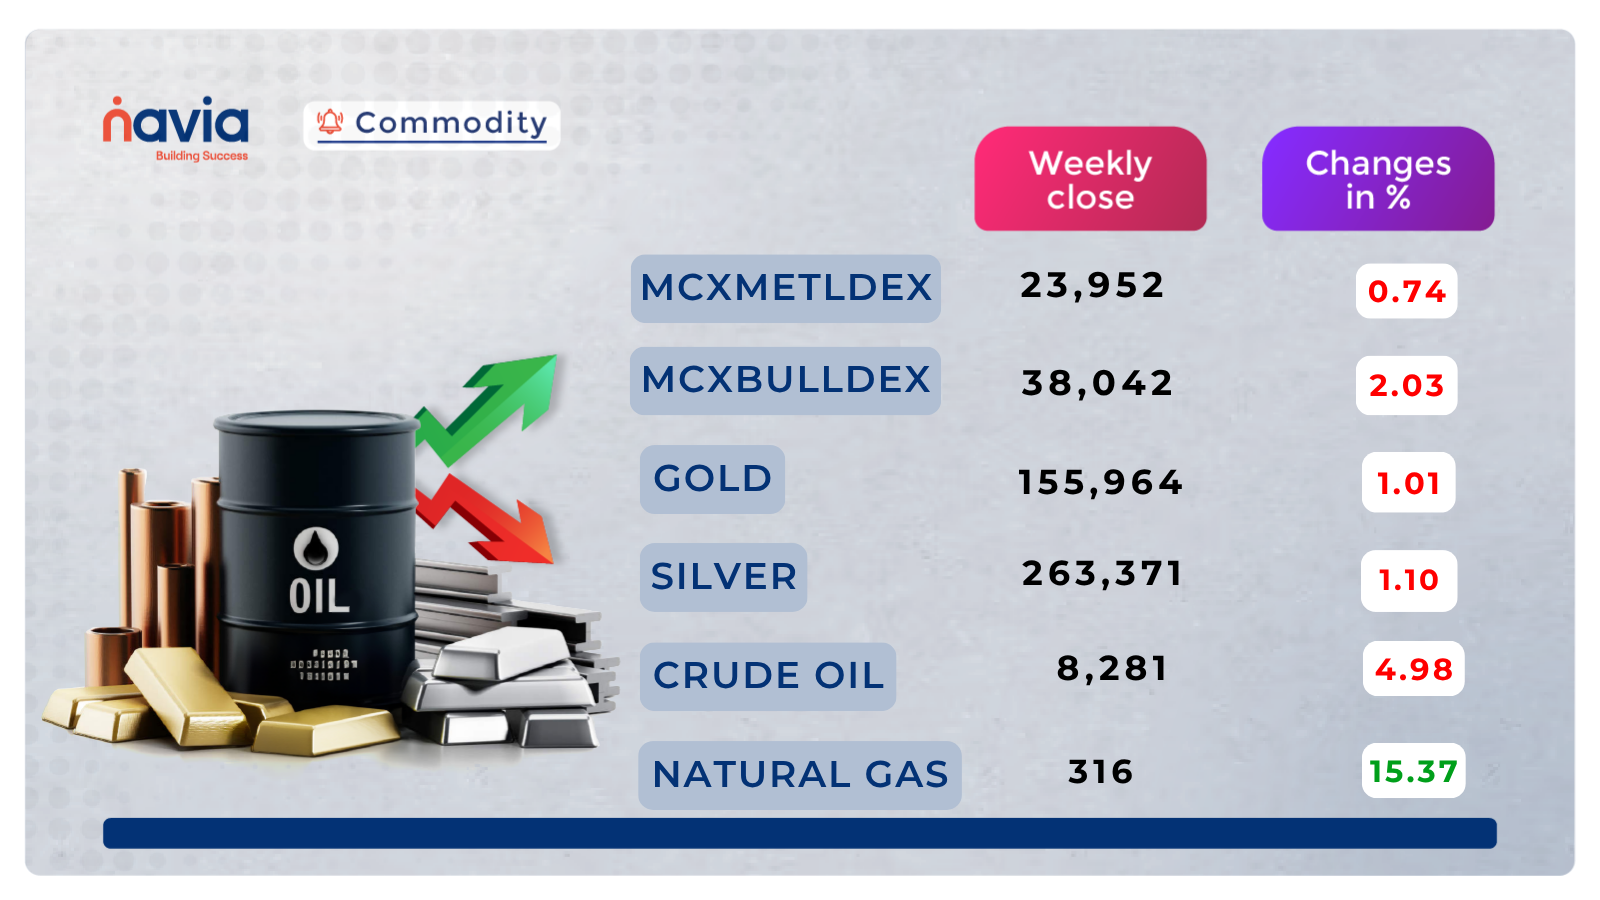
Crude Oil futures are showing continued mild bearish pressure with a red candle as the price remains well below the prior 10,200 peak and consolidates near the lower end of the recent corrective range. The session reflects persistent seller control, with the price having briefly tested recovery toward 9,156 before fading, and buyer follow-through remaining insufficient to sustain any meaningful upside attempt.
The short-term bias remains cautious, with price trading below the key 9,155 resistance and the broader corrective structure from the May highs still intact. The long-term ascending trendline from early May continues to provide structural support beneath current levels and is now approaching the 8,800–8,900 zone. A decisive close above 9,155 would be needed to signal the beginning of a recovery and attract fresh buying toward 9,200 and 9,245, though momentum favours caution until that level is reclaimed on a closing basis.
On the downside, immediate support is seen near 8,885. A sustained close below 8,885 would confirm renewed bearish continuation and open the path toward 8,840 and 8,795, bringing the long-term ascending trendline into sharper focus as the critical structural reference. The dominant multi-week uptrend continues to favour buyers on significant dips, but near-term price action warrants patience.
Gold futures are showing continued bearish pressure with a prominent red candle following a sharp decline from the 159,500 zone over the prior two sessions. The MACD remains in negative territory with the histogram extending below the signal line, and the RSI has declined to the 38 zone, reflecting building downside momentum and the absence of meaningful buyer defence at current levels.
The short-term bias is cautious-to-bearish, with price having broken below the prior consolidation range near 158,000–159,500 and the ascending trendline from early May now being tested from above. The 157,873–158,000 level now acts as immediate resistance, and a recovery and sustained close above 158,000 would be required to neutralise the current bearish momentum and invite a corrective bounce toward 159,500 and 161,000. However, the MACD and RSI both confirm that sellers remain in control in the near term.
On the downside, immediate support is seen near 157,000, with the ascending trendline from May also converging in this area. A sustained close below 157,000 would confirm the breakdown and accelerate the corrective move toward 155,500 and 154,000, with the RSI potentially extending into oversold territory on such a move. Buyers need to defend 157,000 decisively to prevent a deeper unwind of the May advance.
Natural Gas futures are showing mild negative momentum with a small red candle after the price failed to sustain above the 282 resistance area. The session reflects a continuation of the cautious tone that has prevailed since the sharp pullback from the 300 swing high, with price now consolidating in the narrow 276–282 band and buyers lacking the conviction to drive a sustained recovery.
The short-term bias remains cautious, with the ascending trendline from early May continuing to support the broader structure but the price unable to break decisively above 282. The 279–282 zone is acting as a near-term compression area, and a decisive close above 282 would be required to signal renewed upside intent and attract fresh buying momentum toward 284 and 286. Until that occurs, the path of least resistance remains sideways to marginally lower.
On the downside, immediate support is seen near 276. A sustained close below 276 would confirm the next leg of corrective decline and open the path toward 274 and 272, putting the ascending trendline structure under meaningful pressure. Sellers retain the advantage on any failed push toward the 282 resistance in the near term.
Silver Futures are showing a near-flat session with a red candle as price continues to consolidate below the 273,000 resistance area. The recent price action has been characterised by a series of small-bodied candles between 267,000 and 274,000, reflecting hesitation and a lack of directional conviction on both sides following the sharp corrective decline from the May high near 300,000.
The short-term bias is cautious, with the ascending trendline from late April continuing to compress price from below while overhead supply near 273,000–276,000 caps recovery attempts. The 270,000–273,000 zone is the immediate battleground, and a decisive close above 273,000 would confirm short-term recovery momentum and open the path toward 275,500 and 278,000. Until that breakout occurs, the structure reflects indecision and caution rather than directional conviction.
On the downside, immediate support is seen near 268,000. A sustained close below 268,000 would signal a breakdown from the current consolidation and invite corrective pressure toward 265,500 and 263,000, negating the cautiously neutral setup and shifting near-term control firmly back to sellers.
Do you have a question? Ask here and we’ll publish the information in the coming weeks.
Top Blogs of the Week!

What is Positional Trading? Meaning, Time Frame, and Market Approach
In a market obsessed with split-second price movements, high-frequency algorithms, and chaotic intraday swings, Positional Trading stands out as a patient, strategic alternative.

Expense Ratios Explained: Their Role in Long-Term ETF Performance
When building a long-term investment portfolio, exchange-traded funds (ETFs) are often praised as a cost-effective, transparent way to achieve instant diversification. But while an ETF allows you to own hundreds of stocks simultaneously, it isn’t completely free.
N Coins Rewards

Refer your Friends & Family and GET 500 N Coins.
Do You Find This Interesting?

DISCLAIMER: Investment in securities market are subject to market risks, read all the related documents carefully before investing. The securities quoted are exemplary and are not recommendatory. Full disclaimer: https://bit.ly/naviadisclaimer.