

What Is Fibonacci Retracement?
Introduction Fibonacci retracement is one of the most popular tools in technical analysis. It’s used to identify potential support and resistance levels during a price correction or pullback within a trend. Named after the famous Italian mathematician Leonardo Fibonacci, this tool is based on key ratios derived from the Fibonacci sequence. For new traders and investors, Fibonacci retracement offers a simple and effective way to improve your trading decisions.
What Is Fibonacci Retracement?
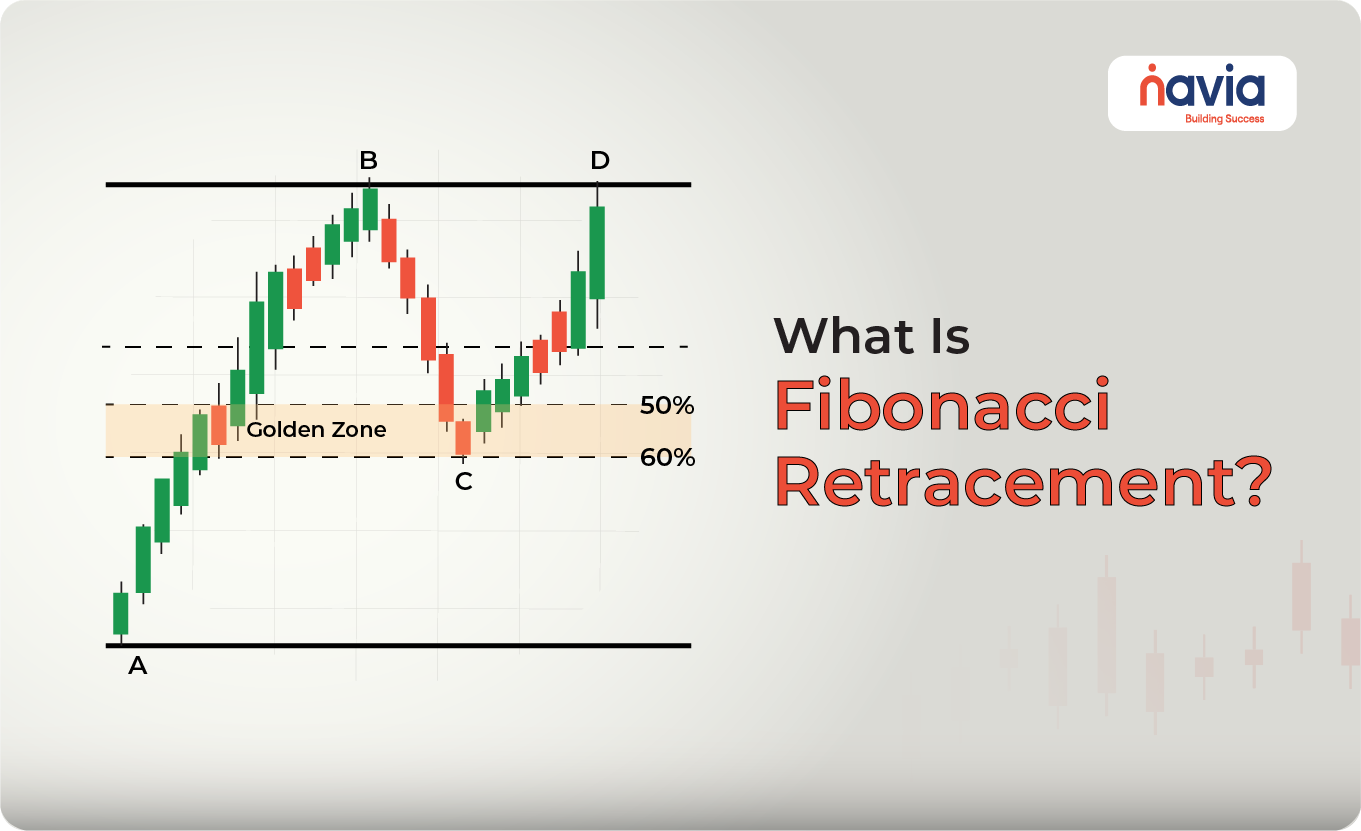
Fibonacci retracement is a tool that plots horizontal lines at key levels based on the Fibonacci ratios: 23.6%, 38.2%, 50%, 61.8%, and 78.6%. These levels help traders identify areas where the price is likely to reverse or continue in the direction of the trend.
1. Retracement Levels: Potential support or resistance during a pullback.
2. Extension Levels: Used to identify potential profit-taking or breakout points beyond the current trend.
How to Use Fibonacci Retracement
1. Identify a Trend
Draw the Fibonacci retracement from the swing low to the swing high in an uptrend.
Draw the Fibonacci retracement from the swing high to the swing low in a downtrend.
Example:
If a stock rises from ₹100 (low) to ₹200 (high), you draw the Fibonacci retracement from ₹100 to ₹200.
2. Key Fibonacci Levels
● 23.6%: Shallow pullback; indicates strong trend continuation.
● 38.2%: Moderate pullback; often acts as the first support/resistance.
● 50%: Common retracement level; not a Fibonacci ratio but widely used.
● 61.8%: Golden Ratio; a strong area for reversals.
● 78.6%: Deep retracement; trend may reverse if price fails to hold this level.
Example:
If a stock rises from ₹100 to ₹200, the retracement levels are:
● 23.6%: ₹176.40
● 38.2%: ₹161.80
● 50%: ₹150.00
● 61.8%: ₹138.20
● 78.6%: ₹121.40
3. Identify Support and Resistance
🠖 Support: In an uptrend, the price often finds support at Fibonacci levels during a pullback.
🠖 Resistance: In a downtrend, the price often encounters resistance at Fibonacci levels during a bounce.
Example:
If a stock in an uptrend pulls back to the 61.8% retracement level and bounces back up, this level acted as support.
4. Combine with Other Indicators
Use Fibonacci retracement alongside moving averages, RSI, or trendlines for confirmation. For example, if the 50% Fibonacci level coincides with the 200-day moving average, it strengthens the support/resistance level.
Example Scenarios
| Scenario | Fibonacci Level | Signal | Trading Insight |
| Shallow Pullback | 23.6% | Strong trend continuation likely. | Look for price to rebound quickly. |
| Moderate Pullback | 38.2% | Initial support/resistance level. | Watch for confirmation of reversal. |
| Common Retracement | 50% | Trend may resume or reverse. | Consider entering a trade with confirmation. |
| Golden Ratio Support/Resistance | 61.8% | Strong reversal potential. | Monitor closely for trend continuation or reversal. |
| Deep Retracement | 78.6% | Weak trend continuation; risk of reversal. | Be cautious; wait for strong confirmation. |
Best Practices for Using Fibonacci Retracement
🔸 Choose a Clear Trend: Apply Fibonacci retracement to well-defined trends with clear swing highs and lows.
🔸 Combine with Price Action: Use candlestick patterns, such as hammer or engulfing candles, to confirm reversals at Fibonacci levels.
🔸 Align with Volume: Higher volume at Fibonacci levels strengthens the likelihood of reversal or continuation.
🔸 Avoid Flat Markets: Fibonacci retracement works best in trending markets, not in choppy or sideways markets
Fibonacci Retracement Strategy in Action
Example 1: Using Fibonacci in an Uptrend
● Scenario: A stock rises from ₹100 to ₹200. During a pullback, it retraces to ₹150 (50% level) before continuing upward.
● Action: Enter a long position near ₹150 if the price shows a bullish candlestick or increasing volume.
● Outcome: The stock resumes its uptrend and reaches ₹250.
Example 2: Using Fibonacci in a Downtrend
● Scenario: A stock falls from ₹500 to ₹300. During a bounce, it retraces to ₹380 (38.2% level) before continuing downward.
● Action: Enter a short position near ₹380 if the price shows a bearish candlestick or decreasing volume.
● Outcome: The stock continues its downtrend to ₹250.

Common Mistakes to Avoid
🠖 Blindly Trusting Levels: Fibonacci levels should be used as a guide, not absolute buy/sell signals.
🠖 Ignoring Market Context: Always consider the overall trend and macroeconomic factors.
🠖 Using Fibonacci in Isolation: Combine with other indicators to improve accuracy.
Conclusion
Fibonacci retracement is a versatile tool that helps traders identify potential support and resistance levels during pullbacks. By mastering this technique, you can enhance your trading strategy and make more informed decisions. Start with the default levels and practice on historical charts to build confidence.
Remember: Fibonacci retracement is a guide, not a guarantee. Use it wisely and always manage your risk.
Happy Trading!
Do You Find This Interesting?
We’d Love to Hear from you-

Frequently Asked Questions
What is Fibonacci retracement in simple terms?
Fibonacci retracement is a technical analysis tool that identifies potential support and resistance levels using percentage ratios derived from the Fibonacci sequence, helping traders spot price reversal zones during a trend.
How do you calculate Fibonacci retracement levels?
To calculate Fibonacci retracement levels, measure the vertical distance between a major swing high and swing low, then apply Fibonacci ratios (23.6%, 38.2%, 50%, 61.8%, 78.6%) to that difference, marking horizontal lines at those prices.
Which are the most important Fibonacci retracement levels?
The most commonly used Fibonacci retracement levels are 38.2%, 50%, and 61.8%, with 61.8% considered the “golden ratio” for potential price reversals.
How is Fibonacci retracement used in trading?
Traders use Fibonacci retracement levels to predict where a price may find support during a pullback in an uptrend or encounter resistance in a downtrend, often making decisions to enter or exit trades based on reactions at these levels.
What is the best strategy for Fibonacci retracement?
The best strategy is to combine Fibonacci retracement with other technical indicators—such as moving averages, RSI, or volume—to confirm potential reversals at key levels, avoiding trades based on Fibonacci lines alone.
DISCLAIMER: Investments in the securities market are subject to market risks, read all the related documents carefully before investing. The securities quoted are exemplary and are not recommendatory. Brokerage will not exceed the SEBI prescribed limit.


