


What are the Best Indicators for Intraday Trading?
- 5 Top Intraday Trading Indicators to Decode the Market
- Moving Averages
- Relative Strength Index (RSI)
- Bollinger Bands
- Volume
- MACD (Moving Average Convergence Divergence)
- Understanding Intraday Indicators
- Significance of Intraday Trading Indicators
- Benefits of Utilizing Intraday Trading Indicators
- Intraday Trading vs. Delivery Trading
- Conclusion
- Frequently Asked Questions
Intraday trading, where you buy and sell securities within the same trading day, demands quick decision-making and precision. To navigate this fast-paced world successfully, traders often rely on indicators. These indicators help them interpret market data and identify potential trading opportunities.
However, given the numerous available options, which ones are considered most optimal for intraday trading? Let’s explore a few highly effective indicators that can improve your intraday trading skills.
💡 Quick Answer
The five intraday indicators covered here are moving averages, the Relative Strength Index, Bollinger Bands, volume and MACD. Moving averages identify trend, RSI measures momentum and overbought or oversold conditions, Bollinger Bands show volatility, volume confirms market activity, and MACD signals momentum shifts. No single indicator ensures success.
5 Top Intraday Trading Indicators to Decode the Market
Moving Averages
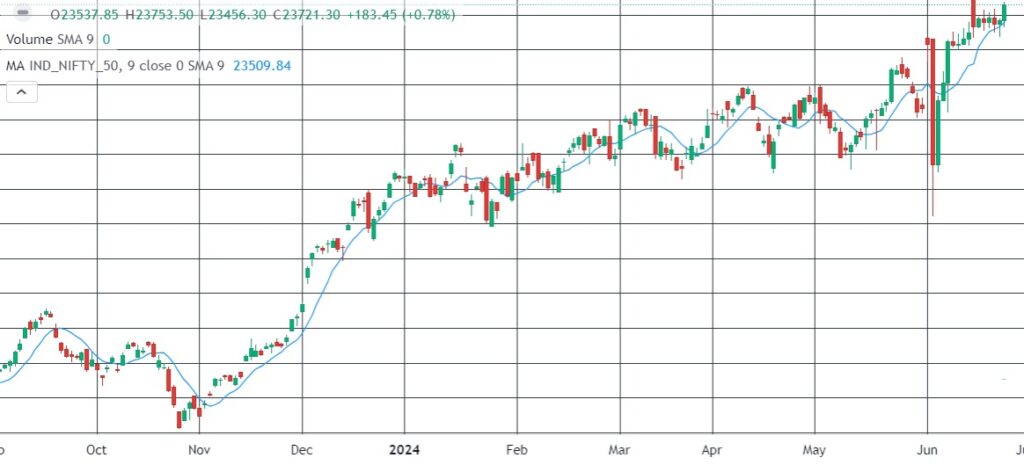
Moving averages smooth out price data to reveal the underlying trend over a specific period. Traders commonly use the 50-period and 200-period moving averages to identify the market’s overall direction. Additionally, the crossover of short-term and long-term moving averages can signal potential entry or exit points. Our guide to moving averages for beginners covers the settings in detail.
Relative Strength Index (RSI)
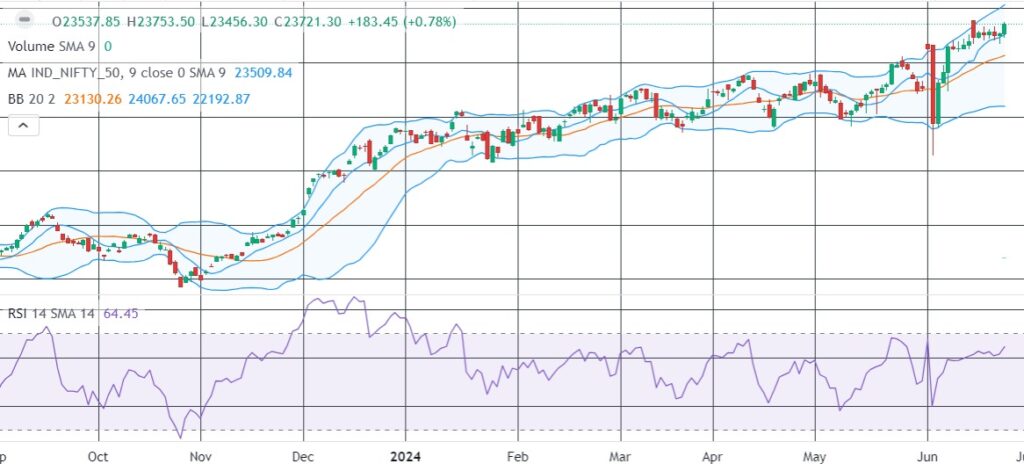
The RSI assesses recent price changes to identify whether a stock is overbought or oversold. Typically ranging from 0 to 100, a reading above 70 suggests overbought conditions, while a reading below 30 indicates oversold conditions. Traders use the RSI to gauge potential reversal points and confirm trend strength. See our full guide to the Relative Strength Index.
Bollinger Bands
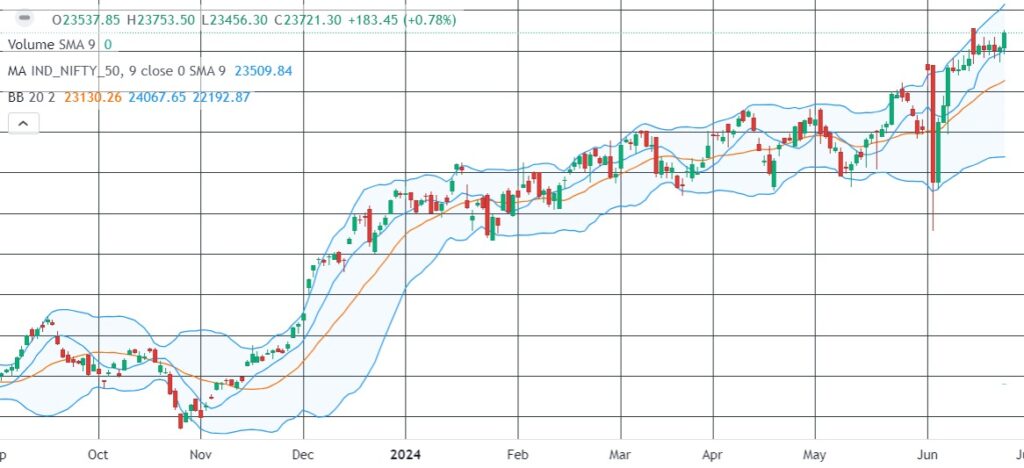
Bollinger Bands comprise a simple moving average with two standard deviations plotted above and below it, expanding and contracting in response to market volatility. When the price touches or crosses the upper band, it may signal overbought conditions, while touching or crossing the lower band may indicate oversold conditions. Traders frequently utilize Bollinger Bands to pinpoint potential entry and exit points. Our guide to using Bollinger Bands for decision making goes further.
Volume
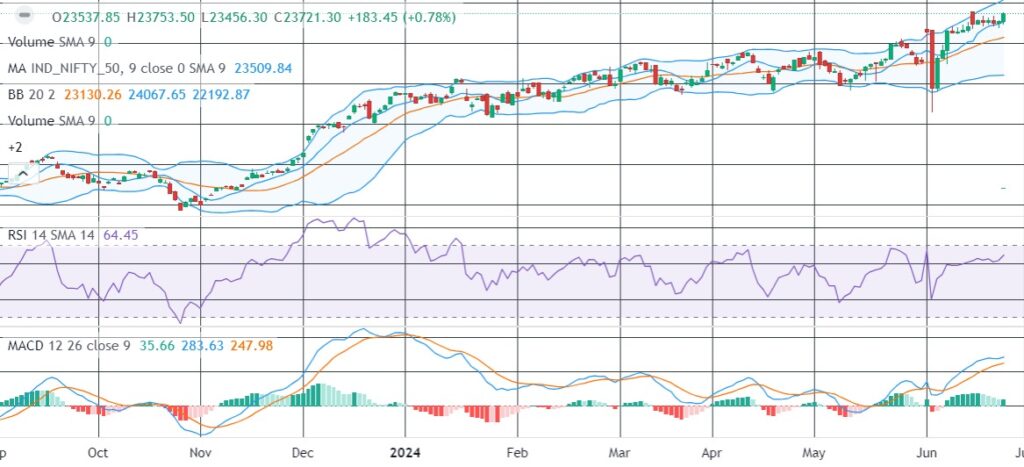
Volume is a crucial indicator in intraday trading as it reflects the level of market activity. An increase in trading volume often accompanies price movements, indicating strong interest from traders. Monitoring volume can help confirm the validity of a price trend or signal potential trend reversals.
MACD (Moving Average Convergence Divergence)
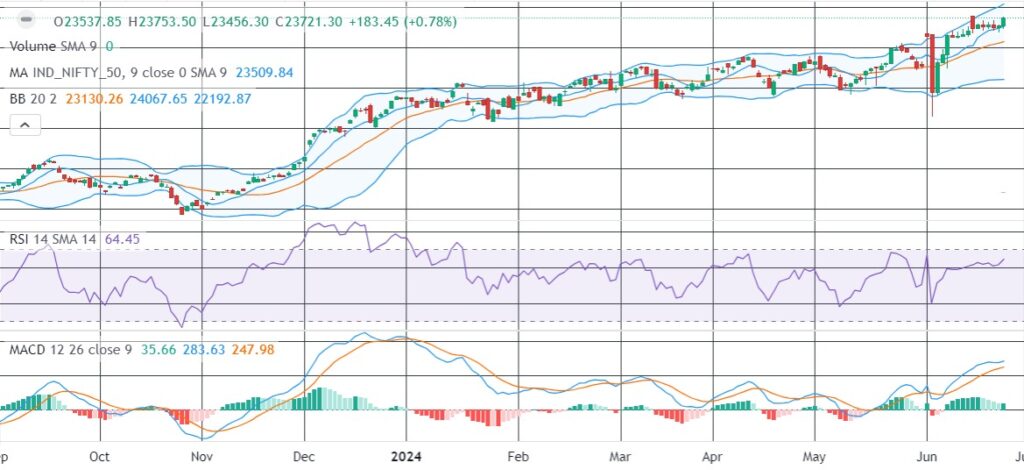
The MACD is a trend-following momentum indicator that illustrates the relationship between two moving averages of a security’s price. Traders pay attention to the MACD line crossing above or below the signal line, which can indicate bullish or bearish momentum shifts, respectively.
Understanding Intraday Indicators
Intraday indicators are crucial tools for day traders to analyze market trends and make decisions within the same trading day. These include moving averages, RSI, stochastic oscillators, volume indicators, and Bollinger Bands.
Moving averages identify trends, oscillators measure momentum, volume indicators reflect market activity, and Bollinger Bands indicate volatility and potential breakouts.
By interpreting these indicators, traders can make informed and timely decisions. It’s essential to use these indicators alongside other technical and fundamental analysis tools for effective trading strategies and risk management.
Significance of Intraday Trading Indicators
Intraday indicators provide valuable insights into market trends, momentum, volume, and volatility, enabling traders to make informed decisions and manage risk effectively. These insights are crucial for maximizing profitability in day trading.

Benefits of Utilizing Intraday Trading Indicators
The primary advantage of intraday trading lies in tracking market trends using accurate indicators. These indicators, derived from mathematical calculations and logical analysis, offer critical information for selecting optimal trading opportunities. Key considerations for intraday traders include:
- Identifying Trends: Trend indicators reveal the market’s direction over a specific time frame, guiding traders on when to enter or exit positions aligned with prevailing trends.
- Assessing Momentum: Momentum indicators like the RSI gauge the strength of price movements and signal potential reversals, aiding traders in timely decision-making.
- Analyzing Volatility: Volatility indicators assess price fluctuations during trading sessions. High volatility indicates significant price movements, while low volatility suggests stable price conditions.
- Monitoring Volume: Volume indicators track trading activity, reflecting market interest in specific stocks. High trading volumes often accompany significant price changes, validating trends or indicating potential reversals.
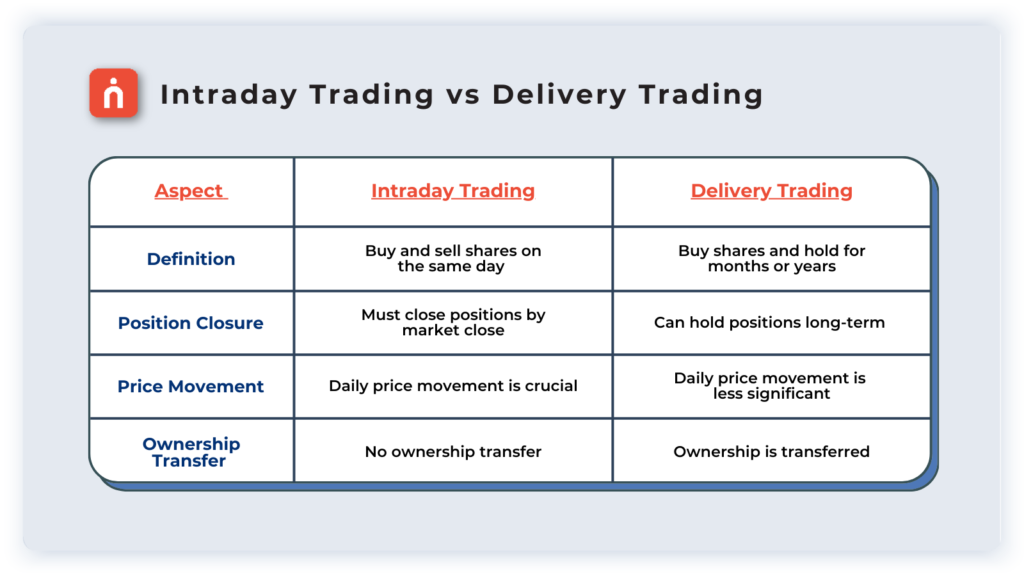
Intraday Trading vs. Delivery Trading
Conclusion
Intraday trading can be a rewarding endeavour with the right tools. Incorporating these indicators into your trading strategy can provide valuable insights into market trends and potential trading opportunities. However, it’s important to note that no single indicator ensures success. It’s the combination of multiple indicators and your interpretation of them that can lead to informed trading decisions. For how these fit into a full session, see our guide to intraday trading strategies, tips and risks.
Ready to embark on your intraday trading journey? Explore a wide range of resources and tools at Navia Markets Limited. Start implementing these intraday trading strategies and techniques today for a brighter trading future!
Key Takeaways
- Five indicators are covered here: moving averages, RSI, Bollinger Bands, volume and MACD.
- The 50-period and 200-period moving averages are commonly used to identify the market’s overall direction.
- An RSI reading above 70 suggests overbought conditions, while a reading below 30 indicates oversold conditions.
- Bollinger Bands expand and contract with volatility; touching the upper or lower band may signal overbought or oversold conditions.
- No single indicator ensures success — it is the combination of indicators and your interpretation of them that supports informed decisions.
Did you find this article helpful?
Your feedback helps us write better content.

Frequently Asked Questions
What are the best indicators for intraday trading?
This article covers five: moving averages, the Relative Strength Index (RSI), Bollinger Bands, volume and MACD (Moving Average Convergence Divergence). Together they cover trend, momentum, volatility and market activity.
What does the RSI tell an intraday trader?
The RSI assesses recent price changes to identify whether a stock is overbought or oversold. It typically ranges from 0 to 100: a reading above 70 suggests overbought conditions, while a reading below 30 indicates oversold conditions. Traders use it to gauge potential reversal points and confirm trend strength.
How are Bollinger Bands used in intraday trading?
Bollinger Bands comprise a simple moving average with two standard deviations plotted above and below it, expanding and contracting in response to market volatility. When the price touches or crosses the upper band it may signal overbought conditions, while touching or crossing the lower band may indicate oversold conditions.
Why is volume important in intraday trading?
Volume reflects the level of market activity. An increase in trading volume often accompanies price movements, indicating strong interest from traders, so monitoring volume can help confirm the validity of a price trend or signal potential trend reversals.
What does the MACD indicate?
The MACD is a trend-following momentum indicator that illustrates the relationship between two moving averages of a security’s price. Traders watch for the MACD line crossing above or below the signal line, which can indicate bullish or bearish momentum shifts respectively.
Can a single indicator guarantee intraday trading success?
No. This article states that no single indicator ensures success — it is the combination of multiple indicators and your interpretation of them that can lead to informed trading decisions.
DISCLAIMER: Investments in the securities market are subject to market risks, read all the related documents carefully before investing. The securities quoted are exemplary and are not recommendatory. Brokerage will not exceed the SEBI prescribed limit. Full disclaimer: https://bit.ly/naviadisclaimer.


