Understanding the Flag Pattern in Technical Analysis

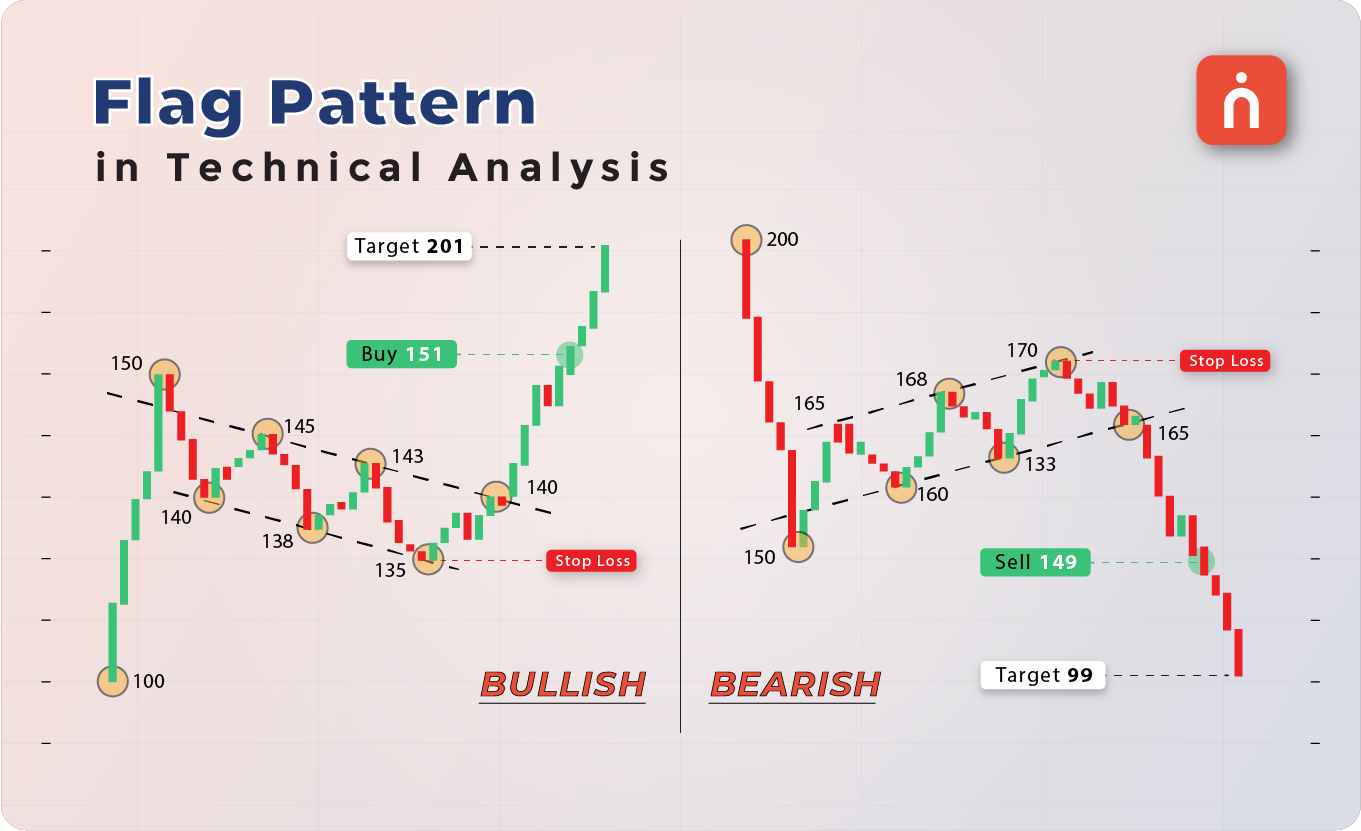
The Flag Pattern is a popular and highly reliable continuation pattern used in technical analysis. It occurs during a sharp price movement (either upward or downward), followed by a period of consolidation in the form of a rectangular or flag-like structure. After this consolidation, the price usually breaks out in the direction of the preceding trend. The Flag Pattern is widely used by traders to capitalize on strong market moves with clear entry and exit points.
In this article, we will break down the Flag Pattern, explain how to identify it, discuss target prices and stop-losses, and provide examples to simplify the concept.
What is a Flag Pattern?
The Flag Pattern typically occurs in the middle of a strong trend, signaling that the market is taking a temporary pause before continuing the move in the same direction. This pattern consists of two key parts:
1) Flagpole:
The initial sharp price movement, often accompanied by strong volume, forms the flagpole.
2) Flag:
After the flagpole, the price consolidates in a small, rectangular range, forming the flag. This consolidation phase is typically characterized by declining volume.
After the price consolidates within the flag, it usually breaks out in the same direction as the original trend, continuing the movement.
Key Characteristics of the Flag Pattern
🠖 Strong Trend:
The pattern must begin with a sharp price move, forming the flagpole. This move could either be upward (bullish flag) or downward (bearish flag).
🠖 Consolidation (Flag):
After the strong price move, the price consolidates within a rectangular or sloping channel. This phase is marked by declining volume.
🠖 Breakout:
After the consolidation, the price typically breaks out in the direction of the preceding trend. The breakout is often accompanied by an increase in volume.
🠖 Volume:
Volume is high during the formation of the flagpole, decreases during the consolidation, and picks up again during the breakout.
Types of Flag Patterns
1) Bullish Flag:
A bullish flag occurs during an uptrend. The price moves sharply upward (flagpole), followed by a brief period of sideways or downward consolidation (flag). The breakout happens to the upside, continuing the uptrend.
2) Bearish Flag:
A bearish flag forms during a downtrend. The price drops sharply (flagpole), followed by a short period of consolidation (flag). The breakout happens to the downside, continuing the downtrend.
How to Identify the Flag Pattern
1) Identify the Flagpole:
Look for a sharp and strong price movement, either upward or downward, forming the flagpole. The stronger the flagpole, the more reliable the pattern.
2) Spot the Flag:
After the flagpole, the price enters a consolidation phase, forming a flag that moves sideways or slightly downward in a bullish flag or slightly upward in a bearish flag. The flag should look like a rectangular channel or a small pennant.
3) Wait for the Breakout:
The pattern is confirmed when the price breaks out of the flag in the same direction as the preceding trend.
Trading the Flag Pattern
Entry Point
● For a bullish flag:
Enter a long position when the price breaks out of the flag to the upside.
● For a bearish flag:
Enter a short position when the price breaks out of the flag to the downside.
Stop-Loss
● For a bullish flag:
Place your stop-loss just below the low of the flag’s consolidation range.
● For a bearish flag:
Place your stop-loss just above the high of the flag’s consolidation range.
Target Price
The target price is typically set by measuring the height of the flagpole and adding (for bullish flag) or subtracting (for bearish flag) that distance from the breakout point.
Significance of the Flag Pattern
1) Continuation Pattern:
The flag pattern is primarily a continuation pattern, meaning that the breakout typically continues in the direction of the preceding trend.
2) High Probability Setup:
Flag patterns are known for their reliability. A strong breakout following consolidation increases the probability of a successful trade.
3) Volume Confirmation:
The strength of the breakout is confirmed by a surge in volume, which validates the continuation of the trend.
When Does the Flag Pattern Occur?
The flag pattern often occurs during a strong trending market, either in bullish or bearish conditions. It typically forms after a sharp price movement (flagpole) as the market takes a brief pause, consolidates, and then resumes the trend.
● In a bullish market, the price forms a bullish flag after a sharp uptrend before continuing higher.
● In a bearish market, the price forms a bearish flag after a sharp decline before continuing lower.
Trading Strategies for Flag Patterns
🔷 Bullish Market:
In a bullish market, traders should look for bullish flags forming after a strong upward movement. A breakout above the flag signals an opportunity to enter a long position.
🔷 Bearish Market:
In a bearish market, traders can look for bearish flags forming after a sharp decline. A breakout below the flag signals an opportunity to enter a short position.
Numerical Example of a Bullish Flag Pattern
Let’s break down a simple example of a bullish flag pattern using numbers.
| Action | Price (₹) | Description |
|---|---|---|
| Initial Uptrend | 100 | The price rises sharply from ₹100 to ₹140, forming the flagpole |
| First Resistance | 140 | Price hits resistance at ₹140 and consolidates |
| First Support | 130 | Price finds support at ₹130 |
| Breakout | 140+ | Price breaks above ₹140, signaling a continuation |
| Target Price | 180 | Target = ₹140 + (₹140 – ₹100) = ₹180 |
| Stop-Loss | 130 | Stop-loss placed just below ₹130 |
Example of a Bearish Flag Pattern
Let’s look at a simple example of a bearish flag pattern:
| Action | Price (₹) | Description |
|---|---|---|
| Initial Downtrend | 200 | The price drops sharply from ₹200 to ₹150, forming the flagpole |
| First Support | 150 | Price finds support at ₹150 |
| First Resistance | 160 | Price rises slightly but fails to break above ₹160, consolidating |
| Breakout | 150- | Price breaks below ₹150, continuing the downtrend |
| Target Price | 100 | Target = ₹150 – (₹200 – ₹150) = ₹100 |
| Stop-Loss | 160 | Stop-loss placed just above ₹160 |
Example of a Bullish Flag with Volume Spike
Let’s illustrate a bullish flag pattern using numerical data:
| Price Action | Price (₹) | Volume | Description |
|---|---|---|---|
| Initial Uptrend | 100 | 1,50,000 | Price moves from ₹100 to ₹140 with high volume (flagpole) |
| Flag Formation | 140 | 50,000 | Price consolidates between ₹130 and ₹140 with declining volume |
| Breakout | 140+ | 2,00,000 | Price breaks above ₹140 with a volume spike to 2,00,000 shares |
In this example, the price rises sharply from ₹100 to ₹140, forming the flagpole with high volume (1,50,000 shares). During the consolidation phase, volume declines to 50,000 shares, indicating a temporary pause. When the price finally breaks out above ₹140, the volume spikes to 2,00,000 shares, confirming the strength of the breakout.
Example of a Bearish Flag with Volume Spike
Here’s a bearish flag pattern example:
| Price Action | Price (₹) | Volume | Description |
|---|---|---|---|
| Initial Downtrend | 200 | 1,80,000 | Price drops from ₹200 to ₹150 with high volume (flagpole) |
| Flag Formation | 150 | 60,000 | Price consolidates between ₹150 and ₹160 with declining volume |
| Breakout | 150- | 2,10,000 | Price breaks below ₹150 with a volume spike to 2,10,000 shares |
In this bearish example, the price drops from ₹200 to ₹150, forming the flagpole on high volume (1,80,000 shares). During the flag formation, the price consolidates between ₹150 and ₹160, and volume drops to 60,000 shares. Upon breaking below ₹150, the volume spikes to 2,10,000 shares, confirming the bearish continuation.

Conclusion
The Flag Pattern is one of the most reliable continuation patterns in technical analysis, offering traders a clear signal for market direction. Whether it’s a bullish flag signaling the continuation of an uptrend or a bearish flag indicating the continuation of a downtrend, this pattern is a powerful tool for traders. By identifying the flagpole, waiting for the breakout, and setting appropriate targets and stop-losses, traders can effectively use the flag pattern in their trading strategies.
We’d Love to Hear from you-
DISCLAIMER: Investments in the securities market are subject to market risks, read all the related documents carefully before investing. The securities quoted are exemplary and are not recommendatory. Brokerage will not exceed the SEBI prescribed limit.


