


Understanding the Rising Wedge Pattern in Technical Analysis
- What is the Rising Wedge Pattern?
- Key Characteristics of the Rising Wedge Pattern
- How to Identify the Rising Wedge Pattern?
- Types of Rising Wedge Patterns
- Example of a Rising Wedge Pattern (Bearish Reversal)
- Significance of Volume in the Rising Wedge Pattern
- Trading Strategies for the Rising Wedge Pattern
- 1. Bearish Reversal (After an Uptrend)
- 2. Bearish Continuation (During a Downtrend)
- Example of a Rising Wedge Pattern with Volume Confirmation
- Summary of Key Elements in the Rising Wedge Pattern
- Conclusion
- Key Takeaways
- Frequently Asked Questions
The Rising Wedge Pattern is a common bearish reversal pattern that signals a potential downward move in price after a period of upward momentum. It can also act as a bearish continuation pattern, indicating that a temporary rise in price during a downtrend will likely continue to fall. This pattern forms when the price is making higher highs and higher lows, but the range between these highs and lows is narrowing, suggesting weakening momentum.
In this article, we’ll break down the Rising Wedge Pattern, explain its significance, and provide clear examples on how to trade it.
💡 Quick Answer
The Rising Wedge is a bearish pattern formed by two upward-sloping trendlines that converge as price makes higher highs and higher lows within a narrowing range. It signals weakening momentum. The pattern is confirmed when price breaks below the lower trendline, ideally on a spike in volume.
What is the Rising Wedge Pattern?
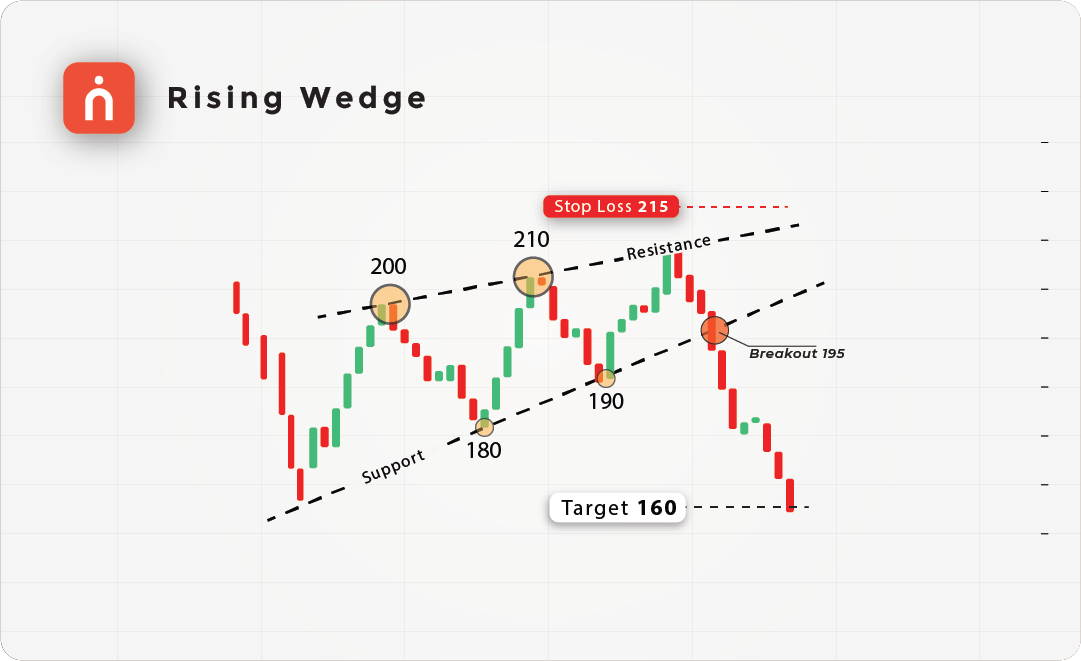
The Rising Wedge Pattern forms when two upward-sloping trendlines converge, connecting a series of higher highs and higher lows. As the price continues to rise, the space between the trendlines narrows, indicating that the upward momentum is losing strength. The pattern is considered bearish because, once the price breaks below the lower trendline, it typically results in a downward move.
This pattern can occur in two different contexts:
1. Bearish Reversal: It forms at the end of an uptrend, signaling a potential reversal to the downside.
2. Bearish Continuation: It forms in the middle of a downtrend, indicating that the temporary upward movement will soon reverse and the downtrend will continue.
Key Characteristics of the Rising Wedge Pattern
1. Upward-Sloping Trendlines:
The pattern is made up of two trendlines:
- An upper trendline that connects the higher highs.
- A lower trendline that connects the higher lows. Both trendlines slope upwards, but they converge, forming a wedge.
2. Narrowing Range:
The distance between the highs and lows becomes smaller over time, reflecting weakening momentum. This tightening range suggests that the price is preparing for a breakout.
3. Bearish Breakout:
The pattern is confirmed when the price breaks below the lower trendline (support level), signaling a potential downward move.
4. Volume:
Volume tends to decrease as the pattern forms, reflecting reduced market interest. A spike in volume at the breakout point confirms the bearish move.
How to Identify the Rising Wedge Pattern?
Look for Higher Highs and Higher Lows:
Spot a series of higher highs and higher lows, indicating that the price is moving upward.
Draw the Trendlines:
Connect the higher highs with an upward-sloping trendline and the higher lows with another upward-sloping trendline. The lines should converge, forming a wedge.
Watch for a Bearish Breakout:
The bearish signal is confirmed when the price breaks below the lower trendline. This suggests that the buyers are losing control, and sellers are stepping in.
Measure the Target Price:
Measure the height of the pattern (the distance between the upper and lower trendlines at the widest point) and subtract that from the breakout point to calculate the target price.
Types of Rising Wedge Patterns
1. Rising Wedge as a Bearish Reversal Pattern
In this case, the Rising Wedge forms after a prolonged uptrend, signaling that the upward momentum is weakening, and the price is likely to reverse and fall.
2. Rising Wedge as a Bearish Continuation Pattern
The Rising Wedge can also appear during a downtrend, indicating that the price is rising temporarily but will soon continue its downward movement after the wedge breaks down.
Example of a Rising Wedge Pattern (Bearish Reversal)
Let’s break down a simple example of a Rising Wedge Pattern:
| Action | Price (₹) | Description |
|---|---|---|
| First Higher High | 200 | Price forms a higher high at ₹200 |
| First Higher Low | 180 | Price forms a higher low at ₹180 |
| Second Higher High | 210 | Price forms a second higher high at ₹210 |
| Second Higher Low | 190 | Price forms a second higher low at ₹190 |
| Breakout (Bearish) | 195- | Price breaks below ₹195, signaling a bearish reversal |
| Target Price | 160 | Target = ₹190 – (₹210 – ₹180) = ₹160 |
| Stop-Loss | 215 | Stop-loss placed above the last high at ₹215 |
In this example, the price forms higher highs at ₹200 and ₹210 and higher lows at ₹180 and ₹190, creating a wedge shape. Once the price breaks below ₹190, it signals a bearish reversal. The target is calculated by subtracting the height of the wedge (₹210 – ₹180 = ₹30) from the breakdown point (₹190), leading to a target price of ₹160. The stop-loss is placed just above the last high at ₹215 to manage risk.
Significance of Volume in the Rising Wedge Pattern
1. Volume plays a critical role in confirming the validity of the Rising Wedge Pattern:
2. Decreasing Volume During Formation:
Volume typically decreases as the price moves within the wedge, reflecting declining interest in the asset and weakening momentum.
3. Volume Spike at the Breakout:
When the price breaks below the lower trendline, a spike in volume confirms the breakout and suggests that sellers are taking control. Without this volume increase, the breakout may be weak, and the price could return to the wedge.
Trading Strategies for the Rising Wedge Pattern
1. Bearish Reversal (After an Uptrend)
- Entry Point: Enter a short position when the price breaks below the lower trendline, confirming the bearish reversal.
- Stop-Loss: Place a stop-loss just above the most recent high (the top of the wedge) to protect against a false breakout.
- Target Price: The target price is calculated by subtracting the height of the wedge from the breakdown point.
2. Bearish Continuation (During a Downtrend)
- Entry Point: Enter a short position when the price breaks below the lower trendline, signaling a continuation of the downtrend.
- Stop-Loss: Place the stop-loss just above the most recent high within the wedge to minimize risk.
- Target Price: As with the reversal pattern, the target is calculated by subtracting the height of the wedge from the breakout point.
Example of a Rising Wedge Pattern with Volume Confirmation
Let’s consider another example where volume plays a role:
| Action | Price (₹) | Volume | Description |
|---|---|---|---|
| First Higher High | 300 | 1,00,000 | Price forms a higher high at ₹300 |
| First Higher Low | 280 | 90,000 | Price forms a higher low at ₹280 |
| Second Higher High | 310 | 80,000 | Price forms a second higher high at ₹310 |
| Second Higher Low | 290 | 75,000 | Price forms a second higher low at ₹290 |
| Breakout (Bearish) | 290- | 1,50,000 | Price breaks below ₹290 with a volume spike, confirming the bearish move |
| Target Price | 260 | Target = ₹290 – (₹310 – ₹280) = ₹260 | |
| Stop-Loss | 315 | Stop-loss placed above the last high at ₹315 |
In this case, the price rises, forming higher highs and higher lows, but the range narrows. When the price breaks below ₹290, a spike in volume confirms the bearish breakout, and the target price is set at ₹260, calculated from the wedge height. The stop-loss is placed above the last high at ₹315.
Summary of Key Elements in the Rising Wedge Pattern
| Pattern Element | Description |
|---|---|
| Trendlines | Two upward-sloping trendlines that converge as the price rises. |
| Higher Highs and Higher Lows | The price makes a series of higher highs and higher lows, but the range between them narrows. |
| Bearish Breakout | The pattern is confirmed when the price breaks below the lower trendline, signaling a downward move. |
| Volume | Volume typically decreases during the pattern’s formation and spikes at the breakout. |

Conclusion
The Rising Wedge Pattern is a reliable bearish pattern that can signal both reversals and continuations of a downtrend. By identifying the narrowing price range between higher highs and higher lows and waiting for a volume-confirmed breakout below the lower trendline, traders can capitalize on the potential price drop.
To trade this pattern effectively, ensure that you:
- Set clear entry points (after the breakout).
- Use stop-losses above the last high to protect against false breakouts.
- Calculate your target price based on the height of the wedge for accurate profit-taking.
Key Takeaways
- The Rising Wedge is a bearish pattern built from two converging upward-sloping trendlines.
- It can be a bearish reversal at the end of an uptrend, or a bearish continuation inside a downtrend.
- A narrowing range between higher highs and higher lows shows upward momentum is fading.
- Confirmation comes when price breaks below the lower trendline; a volume spike validates the move.
- Target = height of the wedge subtracted from the breakdown point; stop-loss goes above the last high.
Related guides: Candlestick patterns · Cup and Handle pattern · Ascending Triangle pattern · Volume in reversal patterns · RSI indicator
Frequently Asked Questions
What is the Rising Wedge pattern?
The Rising Wedge Pattern is a bearish reversal pattern that signals a potential downward move in price after a period of upward momentum. It forms when the price is making higher highs and higher lows, but the range between these highs and lows is narrowing, suggesting weakening momentum.
Is a Rising Wedge bullish or bearish?
The Rising Wedge is bearish. It can act as a bearish reversal pattern at the end of an uptrend, or as a bearish continuation pattern in the middle of a downtrend.
How do you confirm a Rising Wedge breakout?
The pattern is confirmed when the price breaks below the lower trendline. A spike in volume at the breakout point confirms the bearish move; without this volume increase the breakout may be weak and the price could return to the wedge.
How do you calculate the target price for a Rising Wedge?
Measure the height of the pattern — the distance between the upper and lower trendlines at the widest point — and subtract that from the breakout point.
Where should the stop-loss go in a Rising Wedge trade?
Place a stop-loss just above the most recent high, the top of the wedge, to protect against a false breakout.
Do You Find This Interesting?
We’d Love to Hear from you-

DISCLAIMER: Investments in the securities market are subject to market risks, read all the related documents carefully before investing. The securities quoted are exemplary and are not recommendatory. Brokerage will not exceed the SEBI prescribed limit.
Full disclaimer: https://bit.ly/naviadisclaimer


