Understanding the Pennant Pattern in Technical Analysis

The Pennant Pattern is another popular continuation pattern used in technical analysis, similar to the Flag Pattern. This pattern signals that the current trend, whether bullish or bearish, will likely continue after a period of consolidation. The Pennant Pattern is known for its characteristic small, triangular shape that forms during the consolidation phase, resembling a “pennant” or a small symmetrical triangle.
In this article, we will explain how to identify the Pennant Pattern, discuss the significance of volume spikes during the pattern, outline how to trade it, and provide examples to help you better understand this powerful continuation pattern.
What is a Pennant Pattern?
The Pennant Pattern forms after a strong price movement (either upward or downward), followed by a short period of consolidation, after which the price breaks out in the direction of the initial trend. It is called a “pennant” because the consolidation phase narrows into a small triangular structure that resembles a flag on a pole.
The pennant forms when the price starts making lower highs and higher lows, creating converging trendlines. This period of consolidation is typically followed by a breakout in the direction of the prior trend.
Key Characteristics of the Pennant Pattern
1) Sharp Trend (Flagpole):
The pattern starts with a strong and sharp move, either upward (bullish pennant) or downward (bearish pennant). This move forms the flagpole of the pennant.
2) Consolidation (Pennant):
After the flagpole, the price consolidates into a small triangular shape as the highs get lower, and the lows get higher. The converging trendlines form the pennant.
3) Breakout:
The consolidation phase ends with a breakout, which occurs in the same direction as the preceding trend (bullish breakout after an uptrend or bearish breakout after a downtrend).
4) Volume:
Volume tends to be high during the formation of the flagpole, decreases during the pennant’s formation, and spikes again during the breakout.
Types of Pennant Patterns
🔷 Bullish Pennant:
A bullish pennant forms during an uptrend. The price surges higher, forms a small symmetrical triangle (pennant), and then breaks out to the upside, continuing the uptrend.
🔷 Bearish Pennant:
A bearish pennant forms during a downtrend. The price drops sharply, consolidates in the pennant formation, and then breaks out to the downside, continuing the downtrend.
How to Identify the Pennant Pattern
➝ Spot the Flagpole:
Identify a sharp price movement that forms the flagpole. This is the initial, strong trend (either up or down) that sets the stage for the pennant.
➝ Find the Pennant (Triangular Shape):
Look for a triangular consolidation pattern, where the price begins to form lower highs and higher lows, leading to the formation of converging trendlines.
➝ Wait for the Breakout:
The breakout occurs when the price moves decisively beyond the upper trendline (bullish breakout) or lower trendline (bearish breakout).
➝ Volume Confirmation:
Pay attention to volume. A volume spike during the breakout confirms the pattern’s reliability.
Trading the Pennant Pattern
Entry Point
🔷 For a bullish pennant:
Enter a long position when the price breaks out above the upper trendline of the pennant.
🔷 For a bearish pennant:
Enter a short position when the price breaks below the lower trendline of the pennant.
Stop-Loss
🔷 For a bullish trade:
Place your stop-loss just below the lowest point of the pennant (lower trendline).
🔷 For a bearish trade:
Place your stop-loss just above the highest point of the pennant (upper trendline).
Target Price
The target price is typically set by measuring the height of the flagpole (the initial price move before the pennant) and projecting that distance from the breakout point.
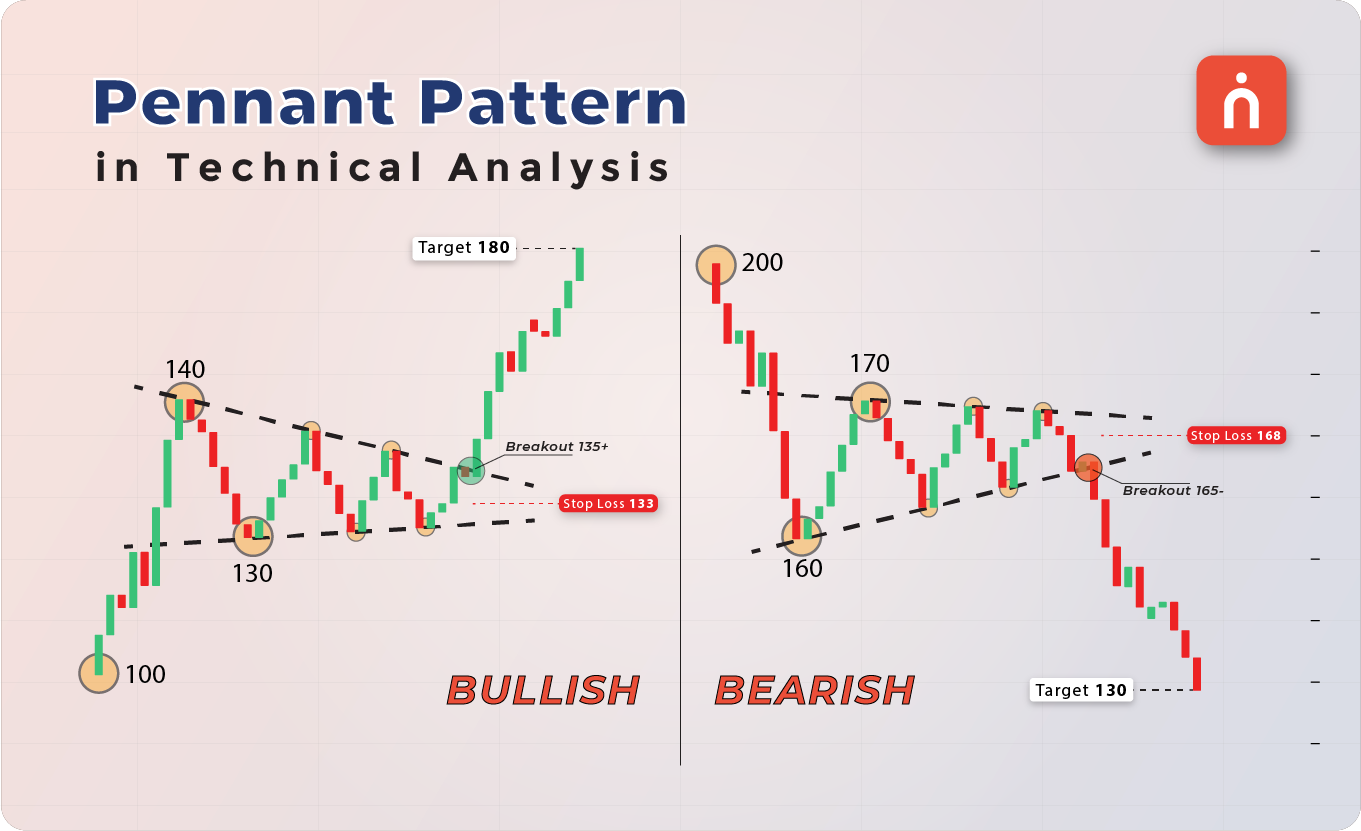
Numerical Example of a Bullish Pennant
Let’s break down a simple example of a bullish pennant pattern using numbers.
| Action | Price (₹) | Description |
|---|---|---|
| Initial Uptrend | 100 | The price moves sharply from ₹100 to ₹140, forming the flagpole |
| First Resistance | 140 | Price consolidates between ₹135 and ₹140, forming the pennant |
| Breakout | 135+ | Price breaks above ₹135 with a volume spike |
| Target Price | 180 | Target = ₹140 + (₹140 – ₹100) = ₹180 |
| Stop-Loss | 133 | Stop-loss placed just below ₹133 |
In this example, the price moves sharply from ₹100 to ₹140, forming the flagpole. The price then consolidates between ₹135 and ₹140, forming the pennant. Once the price breaks out above ₹140, we calculate the target by adding the height of the flagpole (₹40) to the breakout point, setting a target of ₹180. The stop-loss is placed just below the pennant’s low at ₹133.
Significance of Volume Spikes in the Pennant Pattern
1) Volume spikes play a crucial role in confirming the validity of the Pennant Pattern. Here’s how volume impacts the pattern:
2) Flagpole Formation:
High volume accompanies the sharp price move that forms the flagpole. The greater the volume during this move, the more reliable the pattern is.
3) Pennant Formation:
During the consolidation phase (pennant), volume typically decreases as the price contracts within the triangular formation. This decline in volume reflects the temporary pause in the market.
4) Breakout with Volume Spike:
A volume spike during the breakout is essential for confirming the pattern. When the price breaks out of the pennant, a sharp increase in volume indicates strong participation from market players, signaling that the breakout is likely to continue in the direction of the previous trend.
When Does the Pennant Pattern Occur?
The Pennant Pattern occurs during periods of strong trends when the market takes a brief pause to consolidate before resuming the previous trend. It typically forms after a sharp price move (flagpole) in both bullish and bearish markets.
● In a bullish market, the pattern forms after an upward price surge, with consolidation leading to a bullish breakout.
● In a bearish market, the pattern forms after a sharp downward move, with consolidation leading to a bearish breakout.
Example of a Bearish Pennant Pattern
Let’s look at an example of a bearish pennant pattern:
| Action | Price (₹) | Description |
|---|---|---|
| Initial Downtrend | 200 | The price drops sharply from ₹200 to ₹160, forming the flagpole |
| First Support | 160 | Price consolidates between ₹160 and ₹170, forming the pennant |
| Breakout | 165- | Price breaks below ₹165 with a volume spike |
| Target Price | 130 | Target = ₹160 – (₹200 – ₹160) = ₹130 |
| Stop-Loss | 168 | Stop-loss placed just above ₹160 |
In this bearish example, the price drops from ₹200 to ₹160, forming the flagpole. The price then consolidates between ₹160 and ₹170, forming the pennant. The target is calculated by subtracting the height of the flagpole from the breakout point, setting a target of ₹130. The stop-loss is placed just above the upper trendline at ₹168.
Trading Strategies for Pennant Patterns
Bullish Market:
In a bullish market, traders should look for bullish pennants forming after a strong upward move. A breakout above the pennant signals an opportunity to enter a long position.
Bearish Market:
In a bearish market, traders can look for bearish pennants forming after a sharp decline. A breakout below the pennant signals an opportunity to enter a short position.

Conclusion
The Pennant Pattern is a powerful continuation pattern in technical analysis that helps traders identify when the market is likely to resume a strong trend after a brief consolidation. Whether it’s a bullish pennant signaling an upward breakout or a bearish pennant indicating a downward move, this pattern can be highly effective when combined with volume spikes.
By identifying the flagpole, spotting the pennant, waiting for the breakout, and using volume as confirmation, traders can improve their chances of executing successful trades. Incorporating stop-losses and target prices based on the height of the flagpole ensures that risk is managed effectively while capitalizing on the momentum of the breakout.
We’d Love to Hear from you-
DISCLAIMER: Investments in the securities market are subject to market risks, read all the related documents carefully before investing. The securities quoted are exemplary and are not recommendatory. Brokerage will not exceed the SEBI prescribed limit.


