Understanding the Tweezer Top Candlestick Pattern
- What is the Tweezer Top Pattern?
- Psychology Behind the Tweezer Top Candlestick
- Variations of the Tweezer Top
- How to Trade the Tweezer Top Pattern?
- Common Pitfalls to Avoid
- Conclusion
- Frequently Asked Questions
In the world of the 2026 stock market, where market volatility remains elevated, traders are constantly searching for signals that may suggest slowing momentum. Various tools used by technical analysts; few are as visually distinct and psychologically significant as the tweezer top pattern.
If you want to manage your long-term equity portfolio or trading the Nifty 50, recognizing that the moment a bull run hits a “ceiling” can be the difference between managing positions and experiencing declines in value. This guide will help you explore the mechanics, psychology, and trading strategies behind the tweezer top candlestick pattern.
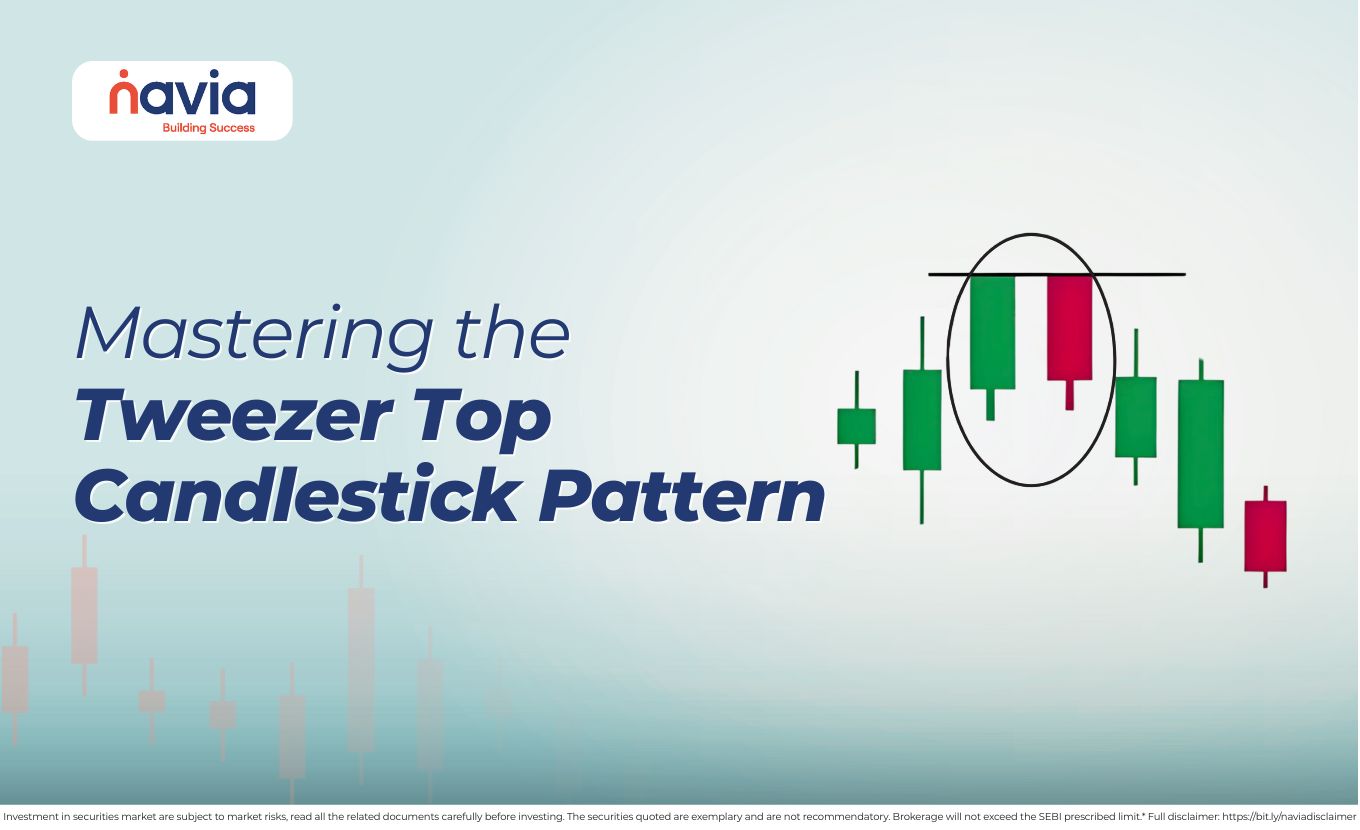
What is the Tweezer Top Pattern?
The tweezer top is a pattern often associated with downward price movement that appears at the end of an uptrend. It consists of two candlesticks-usually one bullish and one bearish-that share the same, or nearly the same, high point. The name “tweezer” comes from the visual representation on the chart; the two identical highs look like the tips of a pair of tweezers. This double hit indicates that the market may be encountering resistance near that level.
Let’s see the criteria that help you to identify a valid tweezer top candlestick:
| Prior Trend | There must be a clear, identifiable uptrend leading into the pattern. |
| The First Candle | A bullish candle that continues the existing trend. |
| The Second Candle | A bearish candle (usually) that opens near the previous close but fails to move higher than the first candle’s peak. |
| Matching Highs | The most critical element is that both candles must have identical or near-identical highs (including the wicks). |
Psychology Behind the Tweezer Top Candlestick
To trade the tweezer top candle pattern effectively, you must understand the tug-of-war happening between buyers and sellers. On the first day of the pattern, the buying activity is dominant. They push the price to a new high, confident that the uptrend will continue. However, by the end of the session, there is a hint of resistance.
On the second day, the market attempts to push higher again. The market participants and sellers are waiting at that exact same peak, so the bulls are trying to break the previous day’s high but are met with an equal and opposite force of selling pressure.
When the second candle closes lower, it sends a change in market sentiment. And signals the buying momentum may be weakening, and the selling activity emerged near that level.
Variations of the Tweezer Top
You must understand that not all tweezer top formations look identical; the bodies of the candles can vary which subtly changes the strength of the signal.
| Standard Tweezer Top | A large bullish candle followed by a large bearish candle of equal height. This is a relatively stronger signal formation. |
| Tweezer Top with Wicks | The bodies may be small, but the long upper wicks hit the same price level. This indicates a “price rejection” and is often seen in volatile markets. |
| The Doji Tweezer | If the second candle is a Doji but shares the high of the first candle, it signifies extreme indecision at the peak, may be followed by downward movement. |

How to Trade the Tweezer Top Pattern?
Understanding the tweezer top candlestick pattern needs patience and additional validation. Entering a trade purely because you see two matching highs can be risky without secondary evidence. Here you can see some of the trading strategies (education purpose only) for trading with tweezer top patterns.
| Identification and Context | Ensure the pattern is formed at a logical place. A tweezer top pattern is may carry higher significance if it occurs at a major psychological level or a historical resistance line. |
| Entry Point | Some market participants rarely enter exactly at the close of the second candle. Instead, they wait for additional validation. This usually comes when the price breaks below the low of the second candle in the next session. |
| Setting Stop-Losses | The beauty of the tweezer top is that it provides a very clear “line in the sand.” Your stop-loss should be placed just a few pips above the matching highs of the tweezers. Movement above that level may reduce the relevance of the pattern. |
| Profit Targets | Targets are typically set at the next major support level or using a 1:2 risk-to-reward ratio. In 2026’s trending markets, many traders also use a trailing stop-loss to track subsequent price movement |
Common Pitfalls to Avoid
While the tweezer top candlestick is a commonly observed technical signal, beginners often fall into these traps;
🔸If the market is moving horizontally, matching highs happens all the time. The pattern only carries weight if it follows a sustained uptrend.
🔸A valid reversal should see a pickup in volume on the second (bearish) candle. Low volume suggests that the “tweezer” might just be a temporary consolidation instead of broader trend change.
🔸A tweezer on a 5-minute chart is noisy. A tweezer on a Daily or Weekly chart is a significant event that widely monitored by market participants.
🔸Trading a Tweezer Top in a “vacuum” (the middle of a price range) is risky. The pattern may gain additional relevance when it aligns with historical resistance, a Fibonacci level, or a major round number.
🔸 While the highs should be nearly identical, being too rigid can cause you to miss potential signals. In high-volatility markets, a difference of a few points is acceptable. Focus on the psychological rejection of the price level rather than mathematical perfection.
🔸Even the most perfect Tweezer Top can be “blown out” by a major news event or earnings report. If a company is about to release positive data, a bearish Tweezer is often just a temporary consolidation before further price movement.
Conclusion
The tweezer top pattern is one of the most visually intuitive signals in technical analysis, represents a moment of clear visual indication where the market collectively agrees that resistance may be emerging near that level. Identifying these matching peaks, you can identify potential reversal situations that catch inexperienced traders at the very top of a cycle.
So, in your next trading, combine the tweezer top with volume analysis and momentum oscillators like the RSI for the additional context.
Do You Find This Interesting?
We’d Love to Hear from you-

Frequently Asked Questions
Is a tweezer top bullish or bearish?
A tweezer top is a bearish reversal pattern. It signifies the end of an uptrend and may indicate weakening upward momentum. Its counterpart, the tweezer bottom, is the bullish version that appears at the end of a downtrend.
What is a tweezer top?
A tweezer top is a two-candle pattern that occurs at the peak of an uptrend. It is defined by two consecutive candles that have matching (or nearly identical) highs.
➢ Candle 1: A bullish candle that continues the existing upward momentum.
➢ Candle 2: A bearish (or sometimes neutral) candle that reaches the same peak as the first candle but fails to break above it, eventually closing lower.
How do you find tweezer top patterns?
To locate a valid tweezer top, follow this three-step checklist:
➔ Look for an Uptrend: The pattern is only valid if it occurs after a sustained move upward.
➔ Identify the “Ceiling”: Find two side-by-side candles where the upper wicks (or bodies) hit the exact same price level. In 2026’s high-frequency markets, a difference of a few pips is usually acceptable.
➔ Analyze the Color Shift: Ideally, the first candle should be green (bullish) and the second should be red (bearish), indicating a shift in market activity.
How do you find tweezer top patterns?
To locate a valid tweezer top, follow this three-step checklist:
▶ Look for an Uptrend: The pattern is only valid if it occurs after a sustained move upward.
▶ Identify the “Ceiling”: Find two side-by-side candles where the upper wicks (or bodies) hit the exact same price level. In 2026’s high-frequency markets, a difference of a few pips is usually acceptable.
▶ Analyze the Color Shift: Ideally, the first candle should be green (bullish) and the second should be red (bearish), showing that the “baton” has been passed from buyers to sellers.
What time frame is best for tweezer tops?
While the pattern appears on all time frames, its patterns may appear clearer on higher timeframes as you move higher:
★ Best for Swing Traders: The Daily (1D) and Weekly (1W) charts. These tweezers represent a major psychological rejection by institutional investors.
★ Best for Day Traders: 15-minute and 1-hour (1H) charts. Patterns on the 1-minute or 5-minute charts are often considered “noise” and frequently lead to false signals.
What indicators confirm a tweezer top?
Since a tweezer top is a “rejection” signal, you should use momentum and volume indicators to confirm the bears are taking over:
🔸Volume: Look for a spike in trading volume on the second (bearish) candle. This confirms that a large number of sellers are defending that price level.
🔸RSI (Relative Strength Index): The signal is much stronger if the RSI is in the “Overbought” territory (above 70) when the tweezers form.
🔸MACD: A bearish crossover (the MACD line crossing below the signal line) occurs simultaneously with the tweezer top, which is an additional bearish indication.
🔸Resistance Levels: If the matching highs occur at a historical resistance line or a “round number” (like 26,500 on the Nifty), the pattern relevance may increase.
DISCLAIMER: Investment in securities market are subject to market risks, read all the related documents carefully before investing. The securities quoted are exemplary and are not recommendatory. Full disclaimer: https://bit.ly/naviadisclaimer.