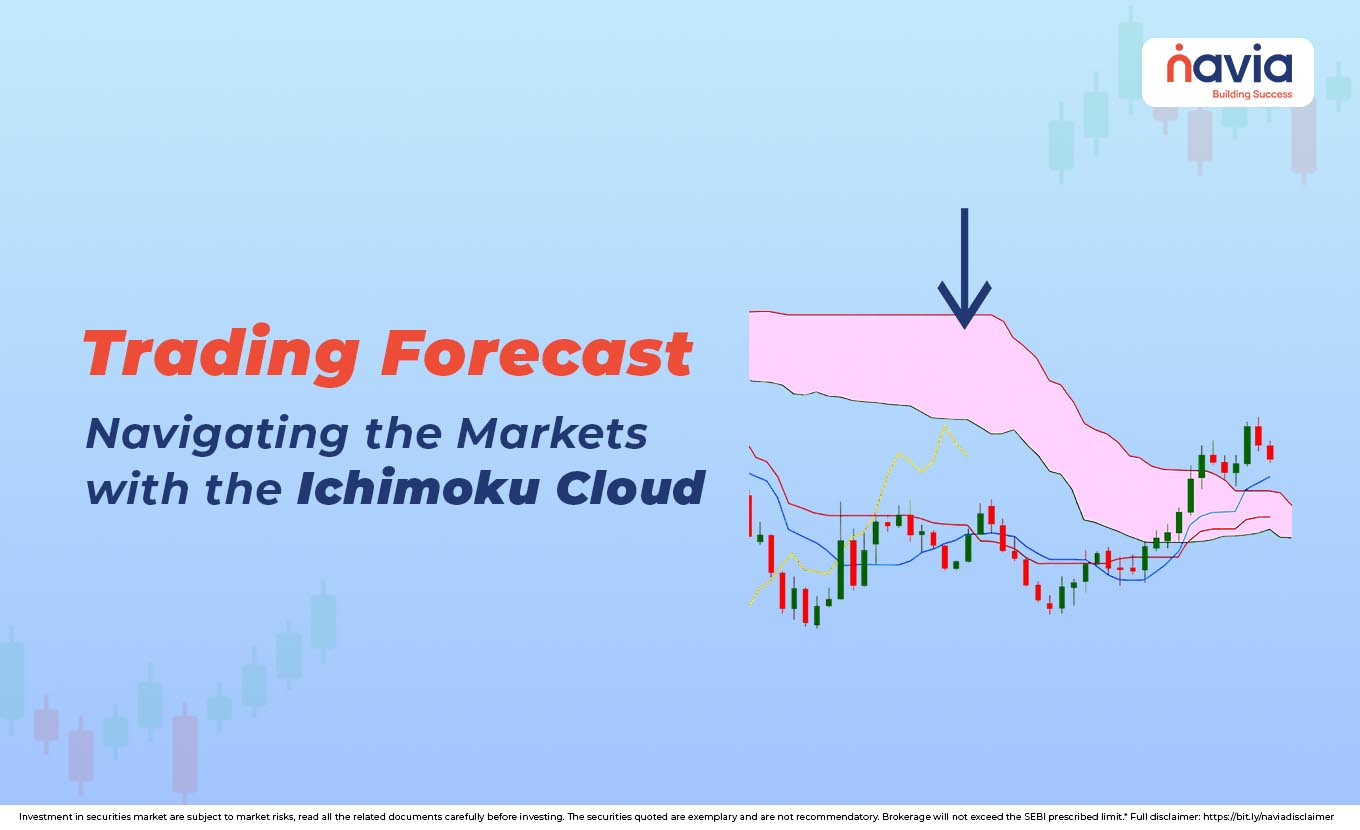
Trading Forecast: Navigating the Markets with the Ichimoku Cloud
- What is the Ichimoku Cloud?
- The Five Lines of the Ichimoku Cloud Strategy
- What are the Three Pillars of Ichimoku Cloud Strategy?
- Advantages and Disadvantages of the Ichimoku Cloud
- Final Thoughts
- Frequently Asked Questions
The Ichimoku Cloud is a Japanese chart indicator used to predict trend direction, support and resistance, and momentum – ideal for swing and position traders.
Most traders master their technical analysis with simple moving averages, but after you realize that the market trends and volatility are multi-layered, you might seek a tool.
Enter the Ichimoku Cloud, a legendary Japanese indicator that doesn’t show you where the price is; it indicates where it’s been, where it’s going, and whether you should be buying or selling.
The indicator is seen as a complex one, but it’s incredibly powerful and remarkable intuitive once you break down its components.
If you are looking to elevate your trading strategy, this introductory guide will demystify the Ichimoku Cloud and show you how to apply Ichimoku Cloud Strategy in your market analysis.
What is the Ichimoku Cloud?
The Ichimoku Cloud is a collection of five lines, each representing different averages or data points, plotted on a chart. These two line forms look like a shaded area that is called the Kumo or Cloud.
It was introduced in the 1930s by Japanese journalist Goichi Hosoda (pen name Ichimoku Sanjin). The indicator was intended to forecast market movements far into the future.
Compared to other standard indicators, the Ichimoku is unique because it incorporates time and momentum, often forecasting resistance or support levels 26 periods ahead.
The magic of the Ichimoku Cloud indicator provides a complete picture of the market structure.
The Five Lines of the Ichimoku Cloud Strategy
| Components | Description |
|---|---|
| Tenkan-Sen (Conversion Line) – (9 periods) | A fast-moving average, calculated as the average of the highest high and lowest low over the past 9 periods. It measures short-term market momentum and acts as a primary signal line. |
| Kijun-Sen (Base Line) – (26 periods) | A slower-moving average, calculated as the average of the highest high and lowest low over the past 26 periods. It identifies the mid-term trend and serves as a strong support/resistance level and is used as the key confirmation line. |
| Senkou Span A (Leading Span A) | The average of the Tenkan-Sen and the Kijun-Sen but plotted 26 periods ahead. It forms the upper boundary of the Cloud when the price is trending. |
| Senkou Span B (Leading Span B) | The average of the highest high and lowest low over the past 52 periods, also plotted 26 periods ahead. And it forms the lower boundary of the Cloud when the price is trending (and vice versa). It represents the long-term support/resistance forecast. |
| Chikou Span (Lagging Span) | The current closing price plotted 26 periods behind the current candle. It confirms the current trend by comparing the current price to the price from 26 periods ago. |

What are the Three Pillars of Ichimoku Cloud Strategy?
Ichimoku Cloud Strategy relies on confirmations across multiple components: price position relative to the cloud, the crossover of the Tenkan-Sen and Kijun-Sen, and the position of the Chikou Span.
The Kijun/Tenkan Crossover (Signal)
It is considered as the primary short-term trading signal:
| Bullish Signal (Buy) | The Tenkan-Sen (fast line) crosses above the Kijun-Sen (slow line). It is called the “Tenkan-Sen Kijun-Sen Cross” that indicates a shift towards upward momentum. |
| Bearish Signal (Sell) | The Tenkan-Sen crosses below the Kijun-Sen; that indicates a shift toward downward momentum. |
The Cloud Confirmation (Context)
Its strongest signals occur when the crossover happens in alignment with the broader trend indicates by the cloud:
| Strong Buy | The Tenkan-Sen crosses above the Kijun-Sen while the price is above the Cloud. |
| Strong Sell | For a sell trade, the Chikou Span should be below the price 26 periods ago. |
The Chikou Span Confirmation (Verification)
The Chikou Span provides the final layer of trend confirmation:
| Bullish Confirmation | For a buy trade, the Chikou Span should be above the price 26 periods ago. This confirms that the current momentum is stronger than the past momentum. |
| Bearish Confirmation | For a sell trade, the Chikou Span should be below the price 26 periods ago. |
Advantages and Disadvantages of the Ichimoku Cloud
| Advantages | Disadvantages |
|---|---|
| It delivers support, resistance, trend direction, momentum, and outlook – all on a single chart. | Like most trend-following tools, the Ichimoku Cloud performs poorly in flat, sideways, or ranged markets. |
| Exceptionally good at confirming and following strong trends | The initial visual complexity of the five lines can be overwhelming for beginners, demanding dedicated study time. |
| The Cloud forecasts future support and resistance by plotting 26 periods ahead; a feature standard moving averages lack | While one component (the Cloud) is leading, the Tenkan-Sen and Kijun-Sen are historical averages, meaning the signals they produce are inherently lagging the actual price movement |
Final Thoughts
Ichimoku Cloud is one of the comprehensive technical analysis systems that moves beyond simple tracking the price history. It interpreted price movement within time and momentum and provided actionable forecasts. But if you want to implement an Ichimoku Cloud strategy in 2025, remember this core principle and take confirmation.
After understanding these five elements, you can easily transform your chart from a confusing tangle of lines into a powerful forecasting instrument. So, this single glance balance chart can help you throughout your trading journey. Happy Trading!
Do You Find This Interesting?
We’d Love to Hear from you-

Frequently Asked Questions
What is the Ichimoku Cloud?
The Ichimoku Cloud is a technical indicator that uses five lines – the Kumo cloud, Tenkan-Sen, Kijun-Sen, Senkou Span A and B, and Chikou Span – to help traders identify trend direction, momentum, and potential buy or sell signals with a single glance.
How effective is Ichimoku Cloud?
The Ichimoku Cloud is highly effective, particularly in trending markets, as it offers a comprehensive view of trend direction, momentum, and future support/resistance all in one indicator.
How to read an Ichimoku Cloud?
You read the Ichimoku Cloud by checking three main points:
Cloud Color: The Cloud’s color indicates the future long-term trend (e.g., green Cloud suggests future bullishness).
Price Position: If the price is above the Cloud (Kumo), the trend is bullish (buy signal). If the price is below the Cloud, the trend is bearish (sell signal).
Crossover: A Tenkan-Sen (fast line) crossing above the Kijun-Sen (slow line) is a buy signal.
What are the 5 lines of Ichimoku?
The five essential components are:
1. Tenkan-Sen (Conversion Line): Fast-moving average (9 periods), measures short-term momentum.
2. Kijun-Sen (Base Line): Slower-moving average (26 periods), confirms the mid-term trend.
3. Senkou Span A (Leading Span A): Forms the Cloud boundary, plotted 26 periods ahead.
4. Senkou Span B (Leading Span B): Forms the other Cloud boundary, plotted 26 periods ahead (long-term S/R forecast).
5. Chikou Span (Lagging Span): The current closing price plotted 26 periods behind, used for final trend confirmation.
Do professional traders use Ichimoku?
Yes, many professional traders use the Ichimoku Cloud, especially those focusing on institutional-level technical analysis. They value its ability to quickly provide context on trend strength, risk management levels, and future S/R zones, which are features not found in standard moving averages.
Is Ichimoku good for swing trading?
Yes, Ichimoku is excellent for swing trading. Since swing traders aim to capture moves lasting several days to a few weeks, the indicator’s standard 26-period lookback (Kijun-Sen) and its focus on confirming strong, sustained trends make it ideal for identifying high-probability entry points and holding positions until the trend clearly reverses or enters the Cloud.
DISCLAIMER: Investment in securities market are subject to market risks, read all the related documents carefully before investing. The securities quoted are exemplary and are not recommendatory. Full disclaimer: https://bit.ly/naviadisclaimer.