


Mastering the Swing Trader’s Market: A Guide for Beginner Traders and Investors

- What is a Swing Trader’s Market?
- Key Characteristics of a Swing Trader’s Market
- Market Indices in an Uptrend
- Low Volatility
- Stocks Hitting New Highs
- How Often Does a Swing Trader’s Market Occur?
- Recognizing the Signs of a Swing Trader’s Market
- Above the 21 Exponential Moving Average (EMA)
- MACD Above 0
- Net New Highs
- Large Growth Stocks Participating
- NIFTY 500 for Bagger Stocks
- Timing the Swing Trader’s Market
- Why Patience is Key
- How to Prepare for the Next Swing Trader’s Market
- Stay Informed
- Set Up Your Charts
- Create a Watchlist
- Plan Your Trades
Swing trading is one of the most popular strategies in the stock market. Unlike long-term investing, where you buy and hold stocks for years, swing trading focuses on capturing short- to medium-term gains in a stock (or other financial instruments) over a few days to several weeks. The success of swing trading largely depends on identifying the right type of market, often referred to as the “Swing Trader’s Market.” In this blog, we’ll explore what a Swing Trader’s Market is, how to recognize it, and why it’s essential for traders to understand this concept. By the end, you’ll be better equipped to navigate the markets and make informed trading decisions.
💡 Quick Answer
A Swing Trader’s Market is a market condition with clear trends, low volatility and strong momentum that favours swing trading. The post identifies it by indices above a rising 21 EMA, MACD above zero, robust net new highs, and large-cap and small-cap growth stocks participating.
What is a Swing Trader’s Market?
A Swing Trader’s Market is a specific type of market condition that is highly favorable for swing trading. This is the period when stock prices trend consistently in one direction (up or down), allowing traders to capture significant price movements over a short period. During these times, the market exhibits clear trends, low volatility, and strong momentum, making it easier to identify and profit from swing trades.
Key Characteristics of a Swing Trader’s Market
Market Indices in an Uptrend
The first sign of a Swing Trader’s Market is when major market indices like NIFTY, BANKNIFTY, and SENSEX are in an uptrend. An uptrend is defined as a series of higher highs and higher lows in the price of an index. During an uptrend, the market is generally moving higher, and the overall sentiment is positive.
Low Volatility
Low volatility in the market means that price movements are more predictable and less erratic. This stability is crucial for swing traders because it allows them to plan their trades with greater confidence. In a low volatility environment, stocks tend to follow the broader market trend more closely.
Stocks Hitting New Highs
A key indicator of a Swing Trader’s Market is when a significant number of stocks are hitting new highs. This means that the demand for stocks is strong, and buyers are willing to pay higher prices, which drives the market higher.
How Often Does a Swing Trader’s Market Occur?
Swing Trader’s Markets typically occur 2 to 4 times a year, lasting for a few weeks each time. During these periods, traders can make the bulk of their profits as the market conditions are ideal for swing trading. However, the rest of the year may not be as favorable. When the market is not in a Swing Trader’s Market, stocks may decline or move sideways, making it difficult to achieve significant gains.
In such times, it’s often best to observe the market, hold cash, and wait for the next Swing Trader’s Market to set up. Patience is a critical skill for successful swing trading.
Recognizing the Signs of a Swing Trader’s Market
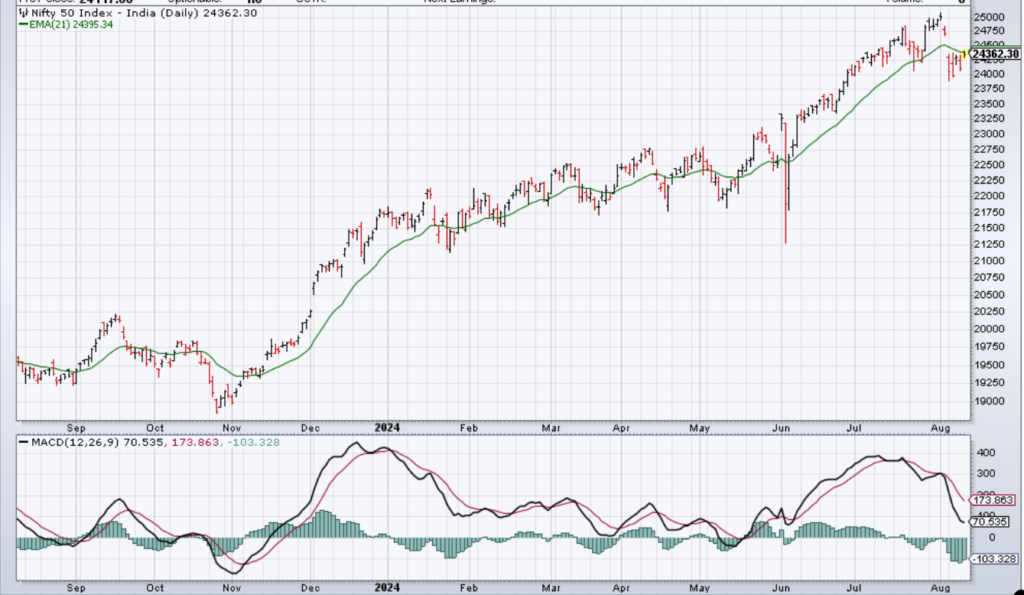
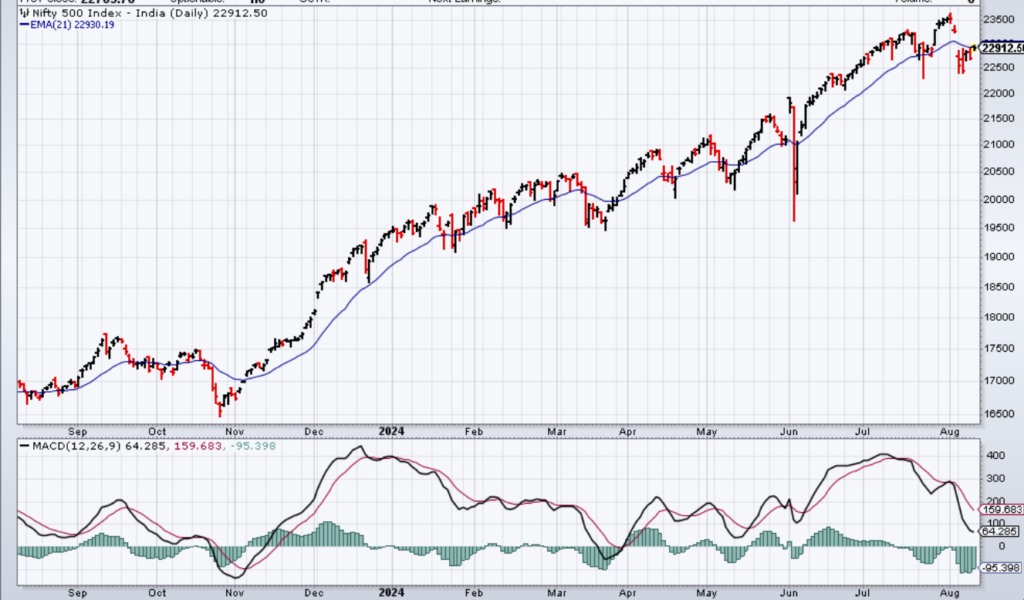
Identifying a Swing Trader’s Market is crucial for maximizing profits. Here are the key signs to look for:
Above the 21 Exponential Moving Average (EMA)
The 21 Exponential Moving Average (EMA) is a popular technical indicator used by traders to determine the direction of the trend. When the price of an index (such as NIFTY, BANKNIFTY, or SENSEX) is above the 21 EMA, it indicates that the market is in an uptrend.
In a Swing Trader’s Market, you’ll typically see the index trending above a rising 21 EMA. This suggests that the overall market momentum is positive, and prices are likely to continue moving higher. Swing traders often use the 21 EMA as a reference point to identify potential entry points for their trades.
MACD Above 0
The Moving Average Convergence Divergence (MACD) is another powerful tool in a swing trader’s arsenal. The MACD measures the difference between two moving averages (usually the 12-day and 26-day EMAs) and helps traders identify changes in momentum.
When the MACD Line is above 0 and trending upwards or moving sideways, it’s a strong indication that the market is in a bullish phase. This means that the underlying trend is positive, and swing traders can look for buying opportunities. Conversely, when the MACD Line is below 0 and declining, it’s a sign that the market is bearish, and it may not be a good time to swing trade.
Net New Highs
The New Highs vs. New Lows breadth indicator is a valuable tool for assessing the overall health of the market. This indicator measures the number of stocks making new 52-week highs versus those making new lows.
In a Swing Trader’s Market, you’ll see a robust number of net new highs. This means that more stocks are hitting new highs than lows, which is a bullish sign. The higher the number of net new highs, the greater the money-making opportunity will be. Swing traders should pay close attention to which sectors and industry groups the new highs are occurring in, as different uptrends bring different investment themes.
On the other hand, if the number of net new lows is increasing, it’s a sign that the market is not in a Swing Trader’s Market, and caution is advised.
Large Growth Stocks Participating
Large-cap growth stocks, such as those in the NIFTY 50 index, are often a key driver of a Swing Trader’s Market. These stocks typically offer significant returns during bullish phases, with some returning 20% to 100% per year in a good year.
When the NIFTY 50 is in an uptrend above a rising 21 EMA, while the MACD is uptrending above 0 and Net New Highs are positive and growing, it’s a strong indication that large-cap growth stocks are participating in the Swing Trader’s Market. This is a favorable condition for swing traders looking to capitalize on the momentum of these high-performing stocks.
NIFTY 500 for “Bagger” Stocks
The NIFTY 500 index is another important gauge for swing traders, especially those looking for smaller growth companies with high potential returns. These “bagger” stocks often have low to negative earnings but large revenue growth rates, making them attractive in a strong market.
When the NIFTY 500 is in an uptrend above a rising 21 EMA, while MACD is uptrending above 0 and Net New Highs are positive and growing, it’s a sign that small-cap growth stocks (baggers) are participating in the Swing Trader’s Market. This offers swing traders an opportunity to capture substantial gains in a relatively short period.
Timing the Swing Trader’s Market
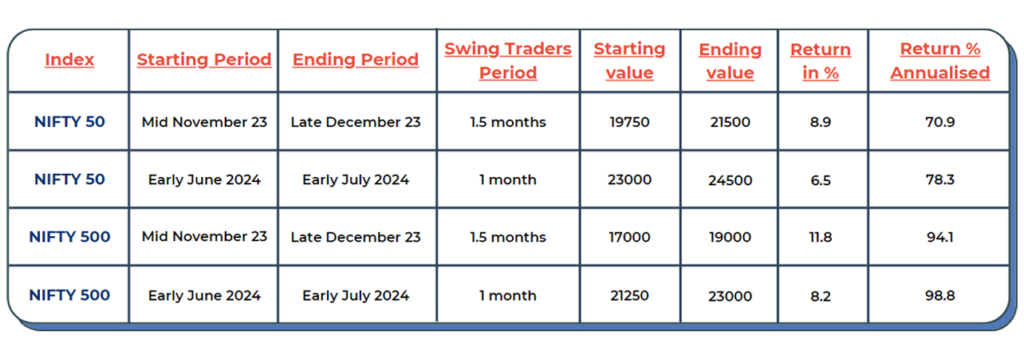
Timing is everything in swing trading. As mentioned earlier, a Swing Trader’s Market occurs 2 to 4 times a year for a few weeks at a time. Let’s take a closer look at a recent example to understand how this works in practice.
From mid-November 2023 to late-December 2023 (1.5 months) and early June 2024 to early July 2024 (1 month), the NIFTY 50 and NIFTY 500 indices exhibited all the signs of a Swing Trader’s Market.
Both indices were trending above their 21 EMA, while the MACD Line (blue MACD line) was above 0. During these periods, traders who recognized the favorable conditions could have made significant profits by swing trading.
In contrast, the rest of the period was not a Swing Trader’s Market. The NIFTY 50 and NIFTY 500 were downtrending and choppy in their 21 EMAs, while the MACD Signal Line spent most of the time in a downtrend or moving sideways. In such conditions, swing trading would have been difficult, and traders would have been better off holding cash and waiting for the next Swing Trader’s Market to set up.
Why Patience is Key
One of the most important lessons in swing trading is the value of patience. Successful swing traders know that not every market condition is favorable for trading. When the market is not in a Swing Trader’s Market, it’s often best to observe, hold cash, and sit on the sidelines.
This is easier said than done, especially when you see other traders making money in the market. However, jumping into trades during unfavorable conditions can lead to losses and frustration. By waiting for the right market conditions, you increase your chances of success and make the most of your trading opportunities.

How to Prepare for the Next Swing Trader’s Market
Now that you know what to look for in a Swing Trader’s Market, how can you prepare for the next one? Here are a few steps to get you started:
Stay Informed
Keep yourself updated on market conditions by following financial news, reading market analysis, and staying connected with other traders. The more informed you are, the better you’ll be able to recognize the signs of a Swing Trader’s Market.
Set Up Your Charts
Make sure you have the right technical indicators set up on your trading platform. This includes the 21 EMA, MACD, and the New Highs vs. New Lows breadth indicator. These tools will help you identify when the market is in a favorable condition for swing trading.
Create a Watchlist
Create a watchlist of stocks that you’re interested in trading during the next Swing Trader’s Market. Look for stocks that have strong fundamentals, are in an uptrend, and are hitting new highs. These stocks are more likely to perform well in a Swing Trader’s Market.
Plan Your Trades
Before entering any trade, make sure you have a plan in place. This includes your entry and exit points.
(All Figures mentioned in this blog are as on the date of publishing.)
Key Takeaways
- A Swing Trader’s Market is a market condition with clear trends, low volatility and strong momentum, which makes swing trades easier to identify and profit from.
- Its three key characteristics are major indices in an uptrend, low volatility, and a significant number of stocks hitting new highs.
- The article says these conditions typically occur 2 to 4 times a year and last a few weeks each time.
- The signs to look for are the index above a rising 21 EMA, the MACD line above 0, robust net new highs, and large growth stocks participating.
- When conditions are not favourable, the article advises observing the market, holding cash and waiting rather than forcing trades.
Did you find this article helpful?
Your feedback helps us write better content.

Frequently Asked Questions
What is a Swing Trader’s Market?
A Swing Trader’s Market is a specific type of market condition that is highly favourable for swing trading. It is the period when stock prices trend consistently in one direction, allowing traders to capture significant price movements over a short period. The market shows clear trends, low volatility and strong momentum.
How often does a Swing Trader’s Market occur?
The article states that Swing Trader’s Markets typically occur 2 to 4 times a year, lasting for a few weeks each time. During those periods traders can make the bulk of their profits, while the rest of the year may not be as favourable.
How do you recognise a Swing Trader’s Market?
The article names four signs: the index trading above a rising 21 Exponential Moving Average, the MACD line above 0 and trending up or sideways, a robust number of net new highs, and large growth stocks such as those in the NIFTY 50 participating in the move.
What does the 21 EMA tell a swing trader?
The 21 Exponential Moving Average is used to determine the direction of the trend. When the price of an index such as NIFTY, BANKNIFTY or SENSEX is above the 21 EMA, it indicates the market is in an uptrend, and swing traders often use the 21 EMA as a reference point for potential entry points.
What should you do when it is not a Swing Trader’s Market?
The article advises observing the market, holding cash and waiting for the next Swing Trader’s Market to set up. It notes that jumping into trades during unfavourable conditions can lead to losses and frustration, and that patience is a critical skill for successful swing trading.
How can you prepare for the next Swing Trader’s Market?
Four steps are given: stay informed by following financial news and market analysis; set up the right indicators on your platform, including the 21 EMA, MACD and the New Highs versus New Lows breadth indicator; create a watchlist of stocks you want to trade; and plan each trade’s entry and exit points before entering it.
DISCLAIMER: Investments in the securities market are subject to market risks, read all the related documents carefully before investing. The securities quoted are exemplary and are not recommendatory. Brokerage will not exceed the SEBI prescribed limit. Full disclaimer: https://bit.ly/naviadisclaimer


