


Marubozu Candlestick Pattern: When One Candle Shows Full Market Control
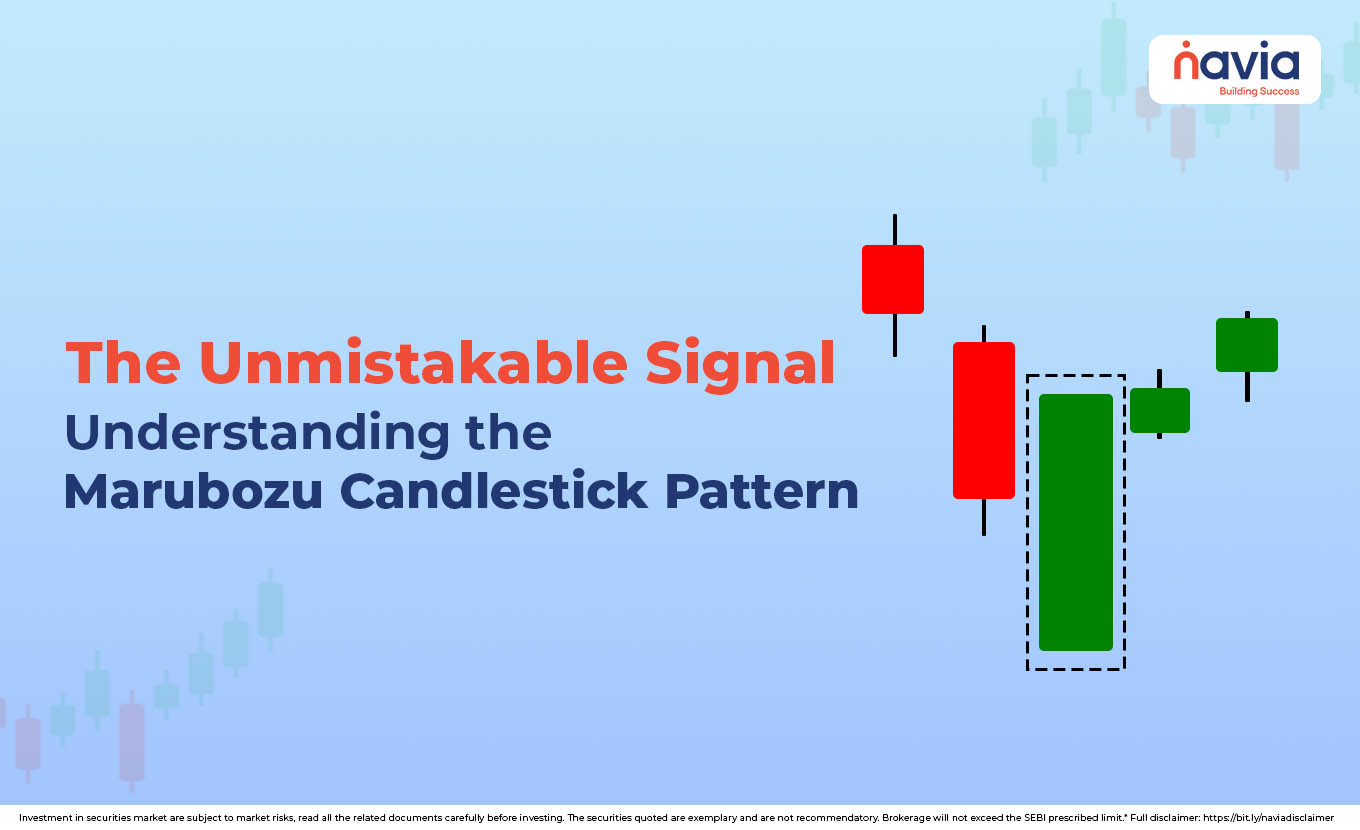
The Marubozu candlestick pattern is a single candle with a full body and no wicks, showing that buyers or sellers controlled the entire session. A bullish Marubozu suggests strong upward momentum, while a bearish Marubozu signals strong selling pressure and possible continuation or reversal of trend.
In the stock market charts, each candle tells a story; some patterns shout their message louder than others. In the list, one of the powerful signals is that Marubozu candlestick pattern has a unique approach because of its bold and direct presence.
Most candles features include a body and “wicks” at their ends, but the Marubozu candle is distinctive for its complete lack of these subtle hints, painting a picture of overwhelming dominance by either buyers or sellers.
The marubozu candlestick pattern is a favorite among traders looking for strong trend continuation or potential reversals. Through this blog you can cut through the noise and identify moments of absolute control of the market by understanding the marubozu candle.
💡 Quick Answer
A Marubozu is a single candle whose open and close are also the session’s high and low, leaving no upper or lower shadow. That shape means one side controlled the entire period without meaningful pushback. A bullish (green) Marubozu opens at the low and closes at the high; a bearish (red) Marubozu does the reverse. Read it in context: inside an existing trend it confirms continuation, and against the trend it warns of reversal. Because the move is already complete by the time the candle closes, late entries carry a poor reward-to-risk ratio — place the stop-loss beyond the opposite end of the candle and confirm with volume.
What is a Marubozu Candlestick Pattern?
The word “Marubozu” is a Japanese word for “bald” or “shaven head”, describing a candlestick that lacks any shadows or wicks. Means, the candle’s open and close prices are also high and low prices for that period. It signals the entire duration of the candlestick formation; buying or selling pressure was continuing. And there was no significant pushback from the opposite side.
There are two primary types of Marubozu:
- Bullish Marubozu
- Bearish Marubozu
These two send a clear and powerful message about market sentiment. It is the structural opposite of the long-wicked rejection candles such as the shooting star, the hammer candlestick pattern and the hanging man pattern, where the wick carries the message instead of the body.
How does a Bullish Marubozu Candlestick Work?
The bullish Marubozu is a powerful indicator of strong buying pressure and is shown in a long and solid green body without upper and lower shadows.
Characteristics of a Bullish Marubozu Candlestick Pattern
| No Upper Shadow | Closing price is the same as the high price of the period, which means buyers pushed the price up to its highest point and kept it until close. |
| No Lower Shadow | The opening price is the same as the low price of the period, which means buyers took control from the very first moment the market opened and never allowed the price to drop below the opening. |
| Long Green Body | The open is at the very bottom, and the close is at the very top. |
What the Bullish Marubozu Means:
A bullish marubozu signals:
- Buyers were in absolute control from the opening bell to the closing bell.
- There was overwhelming optimism, with sellers having no significant impact on the price.
- In an uptrend, confirms the strength of the existing uptrend; that indicates buying momentum is likely to continue.
- In a downtrend, signals a strong reversal, and that suggests the downtrend has exhausted.

How does a Bearish Marubozu Candlestick Pattern Work?
Bearish marubozu is a strong indicator of intense selling pressure and is typically represented by a long, solid red (or black) body with no upper or lower shadows.
Characteristics of a Bearish Marubozu
| No Upper Shadow | The opening price is the same as the high price of the period, which means sellers took control from the very first moment the market opened and never allowed the price to rise above the opening. |
| No Lower Shadow | The closing price is the same as the low price of the period, which means sellers pushed the price down to its lowest point and kept it there until the close. |
| Long Red Body | The open is at the very top, and the close is at the very bottom. |
What the Bearish Marubozu Means:
A bearish marubozu signals:
- Sellers were in absolute control from the opening bell to the closing bell.
- Buyers couldn’t stop the price from falling.
- In an uptrend, signals a strong reversal that suggests that the uptrend has exhausted itself, and sellers have stepped in aggressively.
- In a downtrend, confirms the strength of the existing downtrend; that indicates selling momentum is likely to continue.
Where a Marubozu asserts control in one candle, multi-candle formations such as the dark cloud cover pattern, the harami candlestick pattern and the evening star candlestick pattern tell the same story across two or three sessions.
What are the Pros and Cons of Trading Marubozu Patterns?
| Advantages | Disadvantages |
|---|---|
| It’s the clearest candlestick pattern, so it’s easily told the right way what the market is thinking. | A single signal isn’t enough. For safety, always confirm your trades using other tools, like checking the trading volume or key price levels. |
| Quickly spot when buyers or sellers are completely dominating the market. | When a Marubozu candle fully appears, the price has often moved so far that entering the trade late might give you a smaller profit compared to the risk you have to take. |
| Applicable across all timeframes and asset classes (stocks, crypto, forex, commodities). | In extremely volatile markets, a Marubozu might appear but quickly reverse in the subsequent candle; that leads to false signals. |
The usual remedy for the false-signal problem is context. Checking the candle against the trend framework of Dow Theory, against the simple moving average indicator, or against the layered view of the Ichimoku Cloud filters out a large share of one-candle head fakes.
Conclusion
The Marubozu candlestick pattern is a powerful indicator, and the simplest signals are the most potent. We already told that it’s bald, shadow-less body screams dominance, leaving no doubt about who controlled the market during that specific period.
By understanding the characteristics of both bullish and bearish marubozu you can integrate this platform into your trading weapons.
So, this essential part of the technical analysis can offer immediate insight into market psychology and momentum. Learn and use Marubozu and gain a clearer, more decisive edge in your trading decisions.
Key Takeaways
- A Marubozu has no upper or lower shadow — the open and close are the session’s extremes.
- A bullish Marubozu opens at the low and closes at the high; a bearish Marubozu opens at the high and closes at the low.
- In the direction of the existing trend it signals continuation; against it, it warns of reversal.
- Its main weakness is late entry — the move is already complete by the time the candle closes.
- Place the stop-loss beyond the opposite end of the candle body, never assume the trend runs forever.
- A Marubozu on low volume is weak conviction — confirm with volume and surrounding price structure.
Did you find this article helpful?
Your feedback helps us write better content.

Frequently Asked Questions
What is a Marubozu candlestick?
A Marubozu candlestick is a powerful, single-candle pattern in technical analysis that signifies absolute control by either buyers or sellers during that trading period. The name comes from the Japanese word meaning “shaven head” or “bald,” because the candle has no upper or lower shadows (wicks). This means the opening price and closing price are also high and low prices for that period.
How reliable is the Marubozu pattern?
The Marubozu pattern is generally considered reliable as a strong indicator of momentum and conviction. Its reliability comes from its unambiguous nature – it shows a complete lack of opposition.
What is the success rate of Marubozu?
It is impossible to assign a single, universal “success rate” to the Marubozu pattern because its performance varies dramatically based on the asset, the timeframe, and the market conditions.
What are common Marubozu trading mistakes?
The most common mistakes traders make when using the Marubozu pattern include:
- Ignoring Context: Trading the pattern in isolation without considering the current market trend, support/resistance levels, or volatility.
- Chasing the Entry: Entering the trade too late after the full candle has formed, which can result in a poor reward-to-risk ratio because the price has already moved significantly.
- No Stop-Loss: Failing to place a protective stop-loss outside the opposite end of the Marubozu candle, assuming the strong trend will continue indefinitely.
- Low Volume Confirmation: Trading a Marubozu that forms exceptionally low trading volume, which suggests the conviction behind the move may be weak or temporary.
How to identify a Marubozu candlestick?
To identify a Marubozu candlestick on a chart, look for a candle where:
- Body Dominance: The candle is characterized by a long, full body (either green/white for bullish or red/black for bearish).
- No Wicks (Shadows): Visually, there should be no lines extending beyond the top and bottom of the candle’s body.
- Price Extremes: Confirm that the candle’s opening price is equal to one extreme (High or Low), and the closing price is equal to the other extreme.
DISCLAIMER: Investment in securities market are subject to market risks, read all the related documents carefully before investing. The securities quoted are exemplary and are not recommendatory. Full disclaimer: https://bit.ly/naviadisclaimer.


