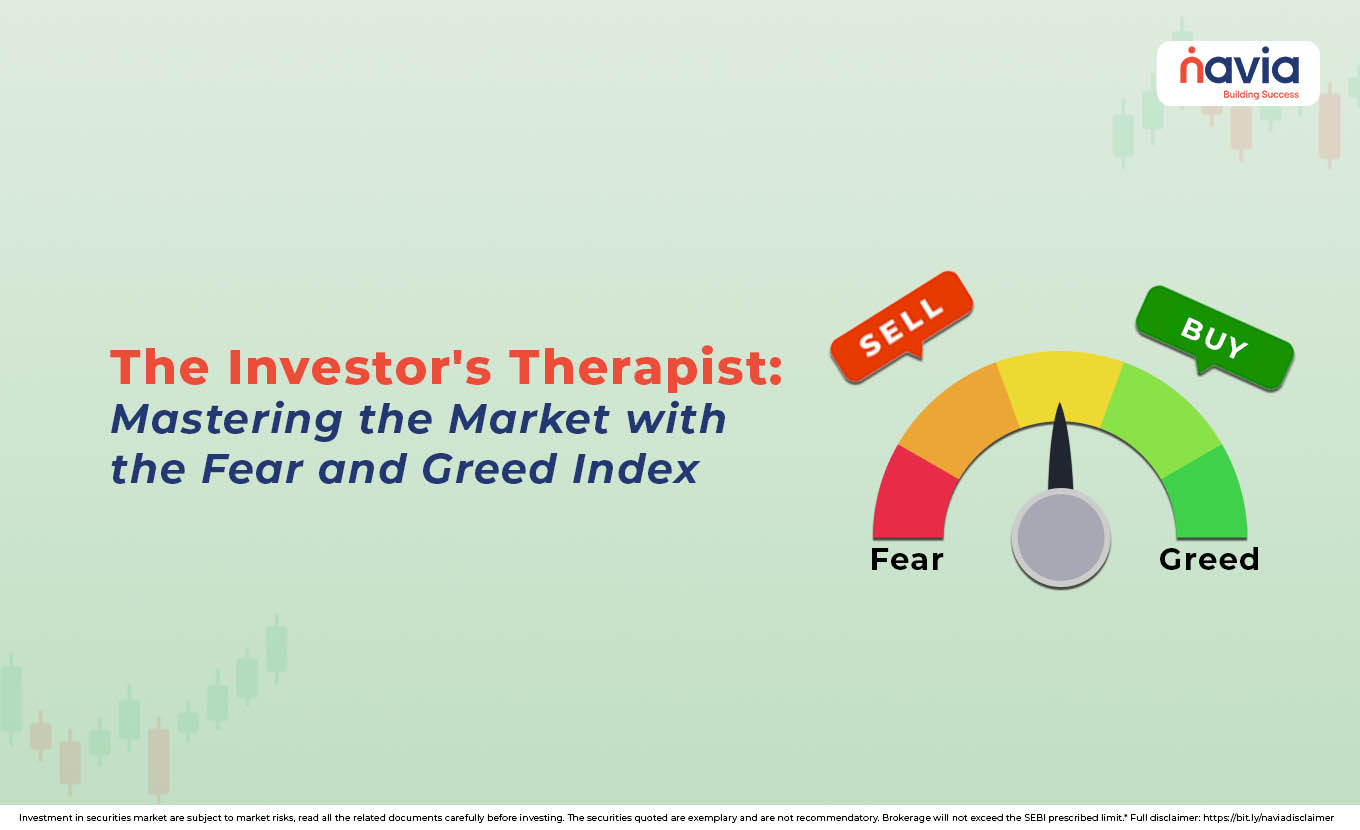
The Investor’s Therapist: Mastering the Market with the Fear and Greed Index
- What is the Fear and Greed Index?
- How the Index Fear & Greed Works?
- Components of the Fear and Greed Index
- Conclusion
- Frequently Asked Questions
The greatest challenge an investor faces in investing isn’t understanding the balance sheets or complex derivatives; it’s mastering your own mind. When the market surges, euphoria whispering you to “buy more”. Like that, when the market crashes, panic screams, “sell everything”. These are the natural emotions, fear and greed; these driving forces behind irrational market behavior.
The critical metric acts as a phycological thermometer for the market, providing a clear, data-driven snapshot of prevailing sentiment. So, understanding the fear and greed index is essential for investors who are looking to make objective data-driven decisions and avoid costly mistakes.
What is the Fear and Greed Index?
The Fear and Greed index is a market indicator, that designed to gauge the dominant emotion influencing investor behavior at any given time. It mainly operates on the principle of contrarian investing, that suggests:
🔸 When the market is dominated by Extreme Greed, it’s likely overvalued and due for correction.
🔸 When the market is dominated by Extreme Fear, prices are likely oversold, presenting potential buying opportunities
It refines numerous technical and market indicators into a single, easy-to-read number, typically scaled from 0 (extreme fear) to 100 (extreme greed). It will simply assess whether the crowd is currently panicking or celebrating.
The core idea is simple: emotional markets create opportunities. Collecting the emotional state through this fear greed calculator will help you to avoid being swept up by the crowd and position yourself safe.
How the Index Fear & Greed Works?
Let’s see the fear & greed index market sentiment across a five-point spectrum:
| Index Reading | Sentiment Level | Investor Strategy Implied |
|---|---|---|
| 0 to 25 | Extreme Fear | Buy Signal: Prices are likely oversold due to panic selling. |
| 26 to 45 | Fear | Caution/Buy: Markets are nervous; good accumulation zone. |
| 46 to 54 | Neutral | Wait: Sentiment is balanced; observe other indicators. |
| 55 to 75 | Greed | Caution/Sell: Markets are getting expensive; start trimming positions. |
| 76 to 100 | Extreme Greed | Sell Signal: Markets are likely overbought and prone to a sharp correction. |
By translating the complex market movements into a clear emotional language, the fear and greed index will help investors step back and analyze whether their actions are being guided by logic.

Components of the Fear and Greed Index
The power of fear and greed index comes from combining several underlying indicators. All have the same general philosophy as combining momentum, volatility, breadth and demand metrics. But the components can vary, let’s see some of them;
| Components | Definition |
|---|---|
| Market Momentum | This measures how rapidly the market is moving. |
| Market Volatility | Volatility is often synonymous with panic. A high VIX is usually associated with extreme fear because investors are rushing to buy protection. |
| Market Breadth | This metric assesses whether the rally (or crash) is broad-based. It compares the number of stocks advancing versus the number declining. |
| Safe-Haven Demand | This measures the relative demand for assets considered “safe,” such as bonds (or government securities). |
| Trading Activity (Put/Call Ratio) | The Put/Call ratio measures the volume of bearish option contracts (Puts) versus bullish contracts (Calls). |
All these components are calculated, normalized, and weighted to generate a single score of the fear and greed index daily. Even a slight misspelling of the tool name, like the occasional search for feed and greed index, leads back to this powerful tool, demonstrating its market relevance.
Conclusion
The fear and greed index is the simplest yet most profound tools available for modern investors. By analyzing the objective data provided by this composite fear greed indicator, you can insulate your investment process from panic and euphoria. Whether you call it the index fear and greed or the fear and greed index, its purpose remains constant: to remind you that when everyone else is either wildly selling or carelessly buying, a true opportunity awaits the disciplined contrarian.
So, use this tool in your trading journey to ensure your decisions are rooted in logic, not emotions.
Do You Find This Interesting?
We’d Love to Hear from you-

Frequently Asked Questions
How to calculate greed and fear index?
The Fear and Greed Index is calculated by taking an equal-weighted average of seven different market indicators. For each indicator, the index measures how far its current reading deviates from its long-term average. This deviation is scored on a scale of 0 to 100. All seven normalized scores are then averaged to produce the final, composite index reading.
What is a good fear-greed index score?
There is no “good” score, as the index is designed to signal opportunities for contrarian action.
◉ A good score for buying (if you’re a long-term investor) is typically in the Extreme Fear (0–25) range, as it suggests the market is oversold due to panic.
◉ A good score for selling or taking profits is in the Extreme Greed (76–100) range, as it signals the market is likely overbought and due for a correction.
Is the fear greed index always accurate?
No, the Fear-Greed Index is not always accurate, and it should not be used as a standalone tool. It is a sentiment indicator, which means it tells you what the crowd feels, not precisely what the market will do.
Is the index useful for beginners?
Yes, the index is very useful for beginners because its primary benefit is emotional control. It provides a simple, objective number that helps a new investor avoid panic selling and FOMO (Fear of Missing Out).
How is the CNN fear and greed index calculated?
The CNN Fear & Greed Index is calculated using seven equal-weighted indicators, including:
➣ Stock Price Momentum (S&P 500 vs. its 125-day moving average).
➣ Stock Price Strength (Number of stocks hitting 52-week highs vs. lows).
➣ Stock Price Breadth (Trading volume in rising versus falling stocks).
➣ Put and Call Options (Demand for Bearish Puts vs. Bullish Calls).
➣ Junk Bond Demand (Spread between junk bond yields and investment-grade bonds).
➣ Market Volatility (CBOE Volatility Index, or VIX).
➣ Safe Haven Demand (Returns of stocks vs. returns of Treasury bonds)
DISCLAIMER: Investment in securities market are subject to market risks, read all the related documents carefully before investing. The securities quoted are exemplary and are not recommendatory. Full disclaimer: https://bit.ly/naviadisclaimer.