

Understanding the Falling Wedge Pattern in Technical Analysis
The Falling Wedge Pattern is a popular bullish continuation or reversal pattern in technical analysis, indicating that a stock or asset’s price is likely to rise after a period of consolidation. This pattern is identified by two converging trendlines that slope downward, where the price makes lower highs and lower lows. The contraction of the price range suggests a slowdown in bearish momentum, setting the stage for a potential breakout to the upside.
In this article, we will explain the Falling Wedge Pattern, how to identify it, how it works, and how to trade it with numerical examples. We will also discuss its significance, target prices, stop-loss strategies, and the role of volume in confirming the pattern.
What is the Falling Wedge Pattern?
The Falling Wedge Pattern is characterized by two downward-sloping, converging trendlines that contain the price action. The pattern forms when the price moves lower, but the rate of decline slows down, causing the lower highs and lower lows to converge toward a point. The pattern can indicate a bullish reversal in a downtrend or a bullish continuation in an uptrend.
The pattern is considered complete when the price breaks above the upper trendline, signaling a potential upward breakout. The breakout is often accompanied by a spike in volume, which confirms the reversal or continuation of the trend.
Key Characteristics of the Falling Wedge Pattern
1. Downward-Sloping Trendlines:
The price is contained within two converging trendlines that slope downward. The upper trendline connects the lower highs, while the lower trendline connects the lower lows.
2. Converging Pattern:
The space between the two trendlines narrows as the pattern progresses, indicating a decrease in volatility and a slowing bearish momentum.
3. Breakout:
The pattern is confirmed when the price breaks above the upper trendline. This breakout typically signals a bullish move, either a reversal of the downtrend or a continuation of the uptrend.
4. Volume:
Volume usually decreases as the pattern forms and spikes at the breakout, confirming the strength of the breakout.
How to Identify the Falling Wedge Pattern
🠖 Spot the Downward Trend:
Look for lower highs and lower lows forming a narrowing range, indicating that the price is moving within two downward-sloping trendlines.
🠖 Identify the Convergence:
The two trendlines should converge toward each other, forming a narrowing wedge. This shows that the bearish momentum is slowing down.
🠖 Wait for the Breakout:
The pattern is confirmed when the price breaks above the upper trendline. This breakout should be accompanied by a spike in volume.
🠖 Measure the Target:
Measure the height of the wedge (the distance between the upper and lower trendlines at the widest point) and project that distance upward from the breakout point to set the target price.
Trading the Falling Wedge Pattern
Entry Point
Enter a long position when the price breaks above the upper trendline with strong volume, confirming the breakout.
Stop-Loss
Place your stop-loss just below the lower trendline or just below the last low to protect against a false breakout.
Target Price
The target price is calculated by measuring the height of the wedge (the distance between the upper and lower trendlines at the widest point) and projecting that distance upward from the breakout point.
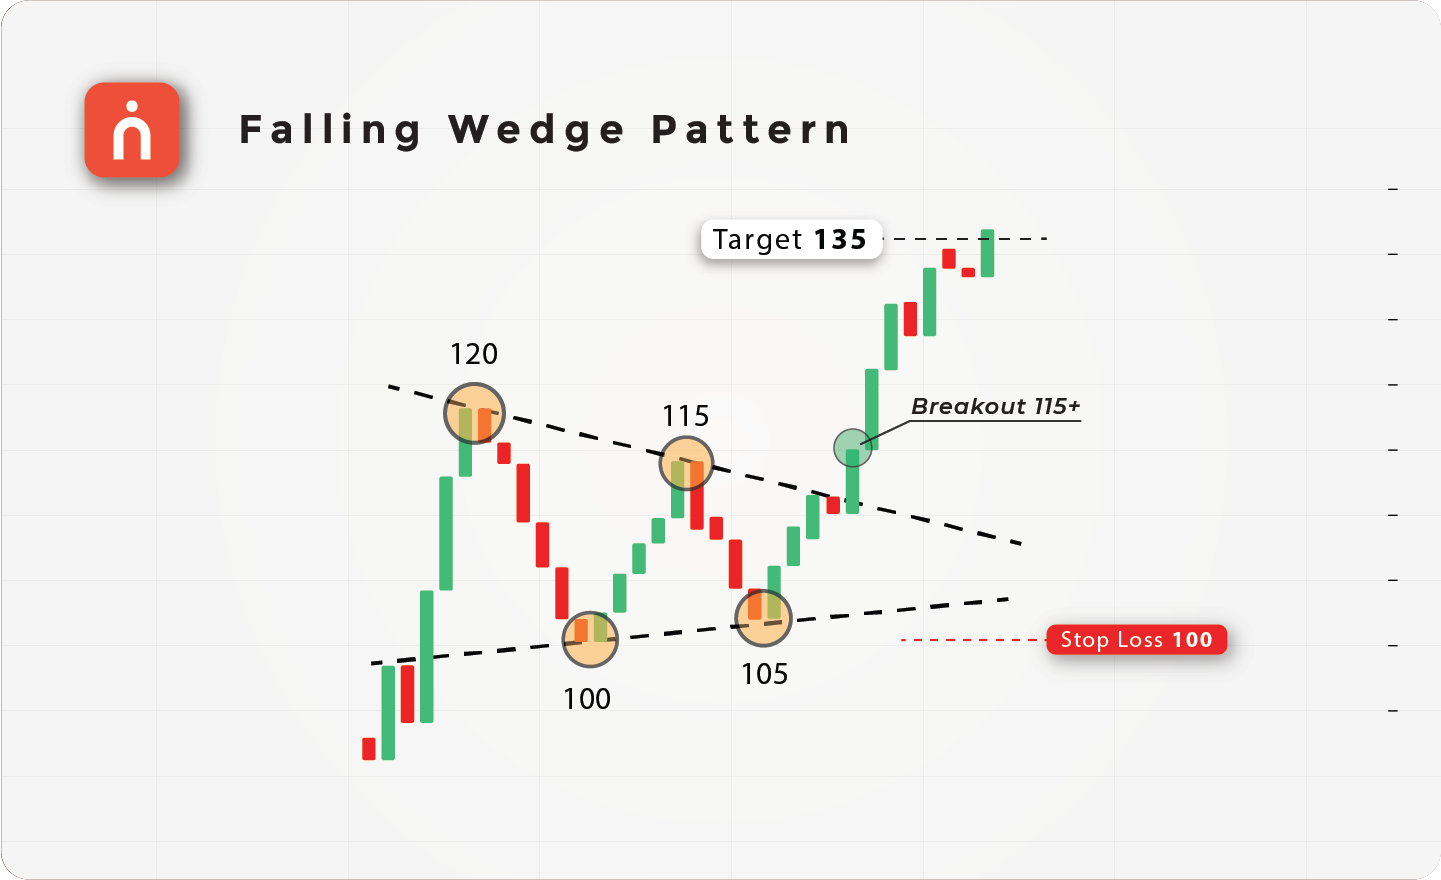
Numerical Example of a Falling Wedge Pattern
Let’s break down a simple example of a Falling Wedge Pattern using numbers.
| Action | Price (₹) | Description |
|---|---|---|
| Upper Trendline | 120 | Price forms a lower high at ₹120 |
| Lower Trendline | 100 | Price forms a lower low at ₹100 |
| Second Lower High | 115 | Price forms a second lower high at ₹115 |
| Second Lower Low | 105 | Price forms a second lower low at ₹105 |
| Breakout | 115+ | Price breaks above ₹115 with strong volume |
| Target Price | 135 | Target = ₹115 + (₹120 – ₹100) = ₹135 |
| Stop-Loss | 100 | Stop-loss placed just below ₹100 |
In this example, the price is contained within two downward-sloping trendlines, forming a wedge. The price forms lower highs at ₹120 and ₹115 and lower lows at ₹100 and ₹105, creating the wedge shape. When the price breaks above ₹115 (the upper trendline), the target is calculated as ₹135, based on the height of the wedge (₹120 – ₹100 = ₹20). The stop-loss is placed just below ₹100 to protect against a false breakout.
Significance of Volume in the Falling Wedge Pattern
Volume plays an important role in confirming the validity of the Falling Wedge Pattern:
1. Volume Decrease During Formation:
Volume often decreases as the wedge forms, reflecting a slowdown in bearish momentum. This reduction in volume indicates consolidation before a potential breakout.
2. Volume Spike at Breakout:
A volume spike during the breakout above the upper trendline confirms that buying interest is returning and the price is likely to continue moving upward. This increase in volume validates the breakout and reduces the risk of a false signal.
Example of a Falling Wedge Pattern with Volume Spike
Here’s another example of a Falling Wedge Pattern with volume:
| Action | Price (₹) | Volume | Description |
|---|---|---|---|
| Upper Trendline | 200 | 1,20,000 | Price forms a lower high at ₹200 |
| Lower Trendline | 180 | 90,000 | Price forms a lower low at ₹180 |
| Second Lower High | 190 | 80,000 | Price forms a second lower high at ₹190 |
| Second Lower Low | 185 | 70,000 | Price forms a second lower low at ₹185 |
| Breakout | 190+ | 1,60,000 | Price breaks above ₹190 with a volume spike |
| Target Price | 210 | Target = ₹190 + (₹200 – ₹180) = ₹210 | |
| Stop-Loss | 180 | Stop-loss placed just below ₹180 |
In this case, the price forms a wedge between the upper trendline at ₹200 and the lower trendline at ₹180. After forming a series of lower highs and lower lows, the price breaks above ₹190 with a volume spike, signaling the breakout. The target price is set at ₹210, and the stop-loss is placed just below ₹180.
When Does the Falling Wedge Pattern Occur?
The Falling Wedge Pattern can occur in both bullish and bearish markets. It can act as a bullish reversal pattern when it forms after a downtrend, indicating that the price is about to reverse to the upside. Alternatively, it can act as a bullish continuation pattern during an uptrend, signaling a temporary consolidation before the uptrend resumes.
The pattern is most effective when it forms over a longer time frame (daily, weekly charts), but it can also be spotted in shorter time frames.
Trading Strategies for Falling Wedge Patterns
1. In Bullish Reversal Markets:
When the Falling Wedge forms after a downtrend, it signals a potential bullish reversal. Traders can look for buying opportunities when the price breaks above the upper trendline.
2. In Bullish Continuation Markets:
When the Falling Wedge forms during an uptrend, it signals that the trend is likely to continue after a brief consolidation. Traders can look to add to their long positions once the breakout occurs.
3. Volume-Based Confirmation:
A volume spike during the breakout confirms the strength of the bullish move. If the breakout occurs with low volume, it might be a false breakout.
4. Target and Stop-Loss Setting:
Use the height of the wedge to set a realistic target price, and place your stop-loss just below the lower trendline or the last low to minimize risk.

Conclusion
The Falling Wedge Pattern is a powerful bullish continuation or reversal pattern that signals a potential price breakout after a period of consolidation. By identifying the downward-sloping trendlines, spotting the breakout, and waiting for a volume-confirmed breakout, traders can take advantage of this pattern to capture potential gains.
With well-defined entry points, stop-loss levels, and target prices, the Falling Wedge Pattern provides a structured and low-risk strategy for traders looking to profit from bullish market reversals or continuations.
Do You Find This Interesting?
We’d Love to Hear from you-

DISCLAIMER: Investments in the securities market are subject to market risks, read all the related documents carefully before investing. The securities quoted are exemplary and are not recommendatory. Brokerage will not exceed the SEBI prescribed limit.


