The Chess Hall Clue: A Setup Traders Watch

- The Final Match That Suddenly Changed
- The Pressure Before the Explosion
- The Signal Most Traders Miss
- The Move Nobody Saw Coming
The Final Match That Suddenly Changed
The state level chess finals in Kolkata had drawn a huge crowd. Cameras flashed, parents whispered nervously, and giant digital clocks ticked loudly inside the silent hall.
At the center table sat sixteen-year-old Ira Sen, the youngest finalist in the tournament. Across from her sat defending champion Rudra Mehta, calm and unreadable.
The match had already crossed three hours. Pieces were disappearing one by one. The crowd expected Ira to lose. Her position looked trapped.
Near the commentary desk, retired chess coach Mr. Bhaskar adjusted his glasses. Beside him, sports journalist Mili whispered, “She looks cornered.”
Bhaskar smiled faintly. “No. Look carefully. She is compressing the position.”
Mili frowned. “Compressing?”
Bhaskar pointed to the board. “Small moves. Tight range. Less space. She’s building pressure quietly.”
Two rows behind them, a young stock trader watching the event suddenly turned around. “That sounds exactly like a market setup.”
Bhaskar smiled without taking his eyes off the board. “Because it is.”
Mili looked confused.
The trader leaned forward and whispered, “It’s called the TTM Squeeze Indicator.”

The Pressure Before the Explosion
The chess clock kept ticking. Nobody moved.
The trader introduced himself as Sourav, a derivatives analyst who followed chess for mental discipline. He pulled out a notebook and started sketching.
“TTM Squeeze is built on two tools. Bollinger Bands and Keltner Channels.”
Mili blinked. “That already sounds dangerous.”
Sourav laughed softly. “Actually, it’s simple.”
He explained slowly. “Bollinger Bands expand and contract based on volatility using standard deviation.”
He wrote:
Bollinger Band = Moving Average ± (2 × Standard Deviation). “If you want, I’ll give a direct calculator link: https://pineify.app/bollinger-bands-calculator”
“Meanwhile, Keltner Channels use ATR, Average True Range.”
Keltner Channel = EMA ± (ATR Multiplier)
Bhaskar nodded. “So one measures statistical volatility, the other measures average price movement.”
“Exactly, now here’s the key.”
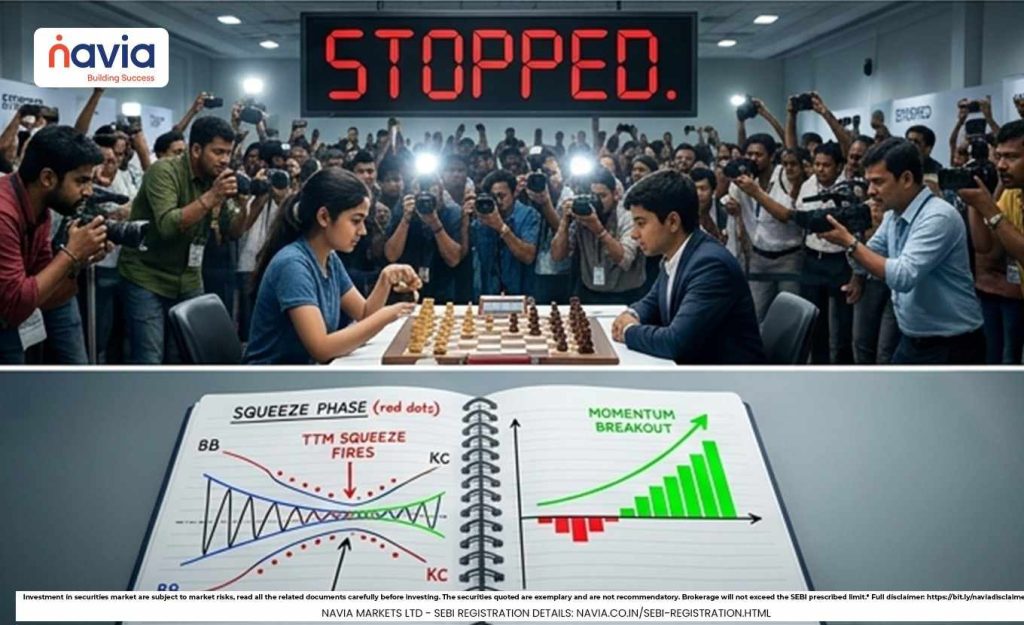
“When Bollinger Bands move inside the Keltner Channels, the market enters a squeeze. That means volatility has become very low.”
Mili whispered, “Like this chess game.”
Sourav smiled. “Yes. Quiet outside. Pressure inside.”
The Signal Most Traders Miss
The hall stayed silent except for the ticking clocks.
Sourav continued carefully. “A squeeze does not tell direction. It suggests that a strong move may come soon.”
Mili nodded slowly.
“The indicator usually shows red dots during the squeeze phase. When volatility expands again and Bollinger Bands move outside the Keltner Channels, the squeeze ‘fires’.”
Bhaskar pointed toward the board. “And then the real attack begins.”
“Exactly,” Sourav said. “That’s why traders combine TTM Squeeze with momentum.”
He explained further. “Most versions include a momentum histogram. If momentum rises while the squeeze releases, some traders look for bullish setups. If momentum weakens, they prepare more cautiously.”
Mili asked, “So the formula itself is not enough?”
“No. One common mistake is trading every squeeze blindly. Traders often wait for breakout confirmation, volume expansion, and momentum alignment.”
He added another technical layer. “Some advanced traders also track squeeze duration. Longer squeezes can sometimes lead to stronger moves because energy builds over time.”

The Move Nobody Saw Coming
Suddenly, the hall gasped.
Ira sacrificed her queen. The audience froze. Three moves later, Rudra’s king had no escape. Checkmate.
The entire room erupted.
Mili stared at the board. “She trapped him slowly…”
Bhaskar smiled proudly. “Pressure. Compression. Then release.”
Sourav closed his notebook. “Markets can behave similarly before strong breakouts.”
As reporters rushed toward the stage, Mili asked one final question. “What’s the biggest lesson?”
Sourav replied calmly, “Big moves don’t always begin in chaos. Sometimes they begin in silence.”
He added, “When studying TTM Squeeze, keep charts clean and focus on volatility plus momentum together. Platforms like the Navia All In One App can help track things without clutter.”
The chess clocks stopped. The crowd still buzzed.
But somewhere between chess and charts, everyone in that hall had learned the same thing.
The quietest moments can sometimes hide the biggest moves.
Do You Find This Interesting?
We’d Love to Hear from you

DISCLAIMER: This story is a fictional illustration created for educational purposes. Investment in securities market are subject to market risks, read all the related documents carefully before investing. The securities quoted are exemplary and are not recommendatory. Brokerage will not exceed the SEBI prescribed limit. Full disclaimer: https://bit.ly/naviadisclaimer