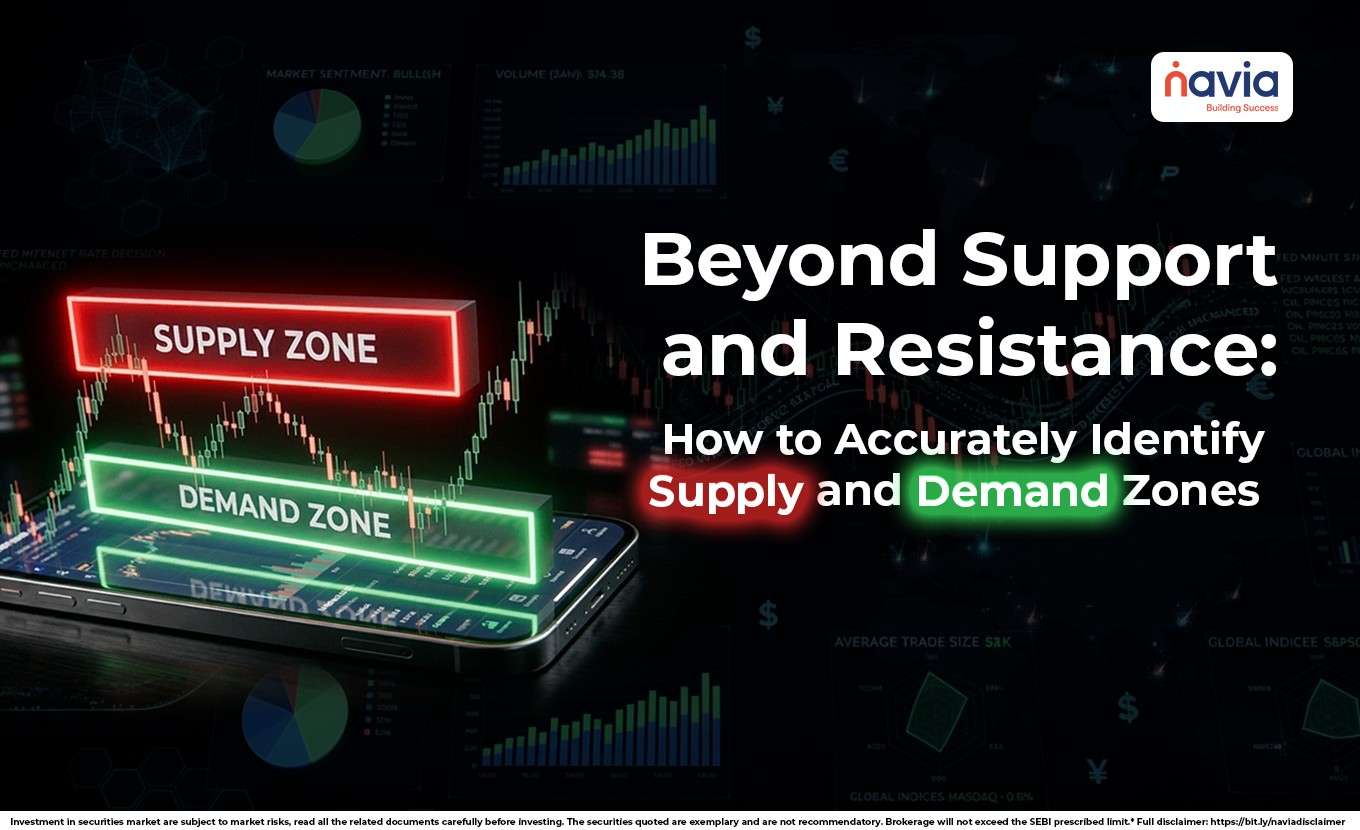
Beyond Support and Resistance: How to Accurately Identify Supply and Demand Zones
- What is Supply Zone and Demand Zone?
- Supply Zone and Demand Zone in Trading vs. Support and Resistance
- How to Identify Supply and Demand Zones?
- Using a Supply and Demand Zone Indicator
- Conclusion
- Frequently Asked Questions
If you ask most new traders how they define where a stock price is likely to turn, they will confidently point to support and resistance lines. These horizontal lines are useful but tell only part of the story. Professional traders who look deeper, focusing on the underlying force that dictates all market movement: supply and demand.
Understanding supply and demand zones is a commonly used concept in technical analysis, that taps into the very psychology and auction mechanics of the financial markets. By mastering this concept, you can develop a structured approach to analyzing price movements.
In this blog we will break down the precise methods for identifying, drawing and trading supply and demand zone.
What is Supply Zone and Demand Zone?
We know that all price movements in the stock market are driven by the balance between buyers (demand) and sellers (supply). A supply zone is a price area on a chart where sellers are likely to be aggressive. There is an “excess supply” of shares available at this level, which may influence price movements when the market revisits the area.
A demand zone is a price area where buyers are aggressive. At this level, excess demand exists, which may act as an area where buying interest has previously appeared. Unlike thin support and resistance line, supply and demand exist as zone because large orders cannot be filled at a single exact price point; they require a range of execution.
Supply Zone and Demand Zone in Trading vs. Support and Resistance
While they seem similar, there is a fundamental difference in concept and execution:
| Feature | Support & Resistance | Supply & Demand Zones |
|---|---|---|
| Origin | Formed by connecting previous highs or lows (reactive). | Formed by analyzing the imbalance of heavy orders (proactive). |
| Appearance | Usually drawn as a thin, exact horizontal line. | Drawn as a broader area (rectangle) of interest. |
| Psychology | Represents where traders think price might turn. | Represents where large orders are actively being filled. |
| Usage | Often used for breakout trading. | Primarily used for reversal trading (buying low, selling high). |

How to Identify Supply and Demand Zones?
Identifying potential supply and demand zones is a structured process. It’s not about guessing; it’s about identifying the specific “origin” of a massive price imbalance. Let see the four key steps (educational purpose only):
| Step 1: Look for an Explosive Price Move | The first and most crucial rule of supply demand trading is identifying an imbalance. You must scan your supply and demand chart for an explosive; strong price movements away from a specific area. This move must be characterized by large-bodied candles and, ideally, a significant spike in volume. A slow, grinding move up is not a strong demand zone; a near-vertical rocket-ship move up is. |
| Step 2: Identify the Base (The “Origin”) | Once you have located the explosive move (the “Leg Out”), you must look immediately to its left to find the consolidation area that preceded it. This is called the “Base.” The Base is the “origin” where the big orders were being matched and filled right before the market “ran out” of one side (either supply or demand). This Base is where you will draw your zone. |
| Step 3: Draw the Zone on Your Supply and Demand Chart | When drawing supply demand zones, the goal is to encompass the majority of the “order clusters.” There are two main ways to draw them: The Aggressive Method (Wick-to-Wick): Draw the rectangle from the highest wick to the lowest wick of the entire basing structure. The Conservative Method (Body-to-Wick): Draw the rectangle from the lowest/highest body close (depending on the zone type) to the extreme wick. This method creates a narrower zone and provides a better risk-to-reward ratio. |
| Step 4: Define the Type of Zone | In supply demand trading, there are four primary structures to look for. Two Reversal Patterns (Highest Probability): Rally-Base-Drop (RBD): This forms a Supply Zone. Price rallies up, creates a base, and then drops explosively. Drop-Base-Rally (DBR): This forms a Demand Zone. Price drops down, creates a base, and then rallies explosively. Two Continuation Patterns: Rally-Base-Rally (RBR): This forms a (less robust) Demand Zone. Price rallies, pauses (bases), and continues to rally. Drop-Base-Drop (DBD): This forms a (less robust) Supply Zone. Price drops, pauses (bases), and continues to drop. |
Using a Supply and Demand Zone Indicator
While manual identification is the best way to master the concept, modern technology can help. These indicators analyze price action (volume and candle size) and automatically plot supply and demand chart rectangles on your screen.
However, be warned: indicators are tools, not trade signals. An indicator may plot several zones on a chart, but some zones may be more relevant depending on market context. You can use the identification steps to filter which ones to trade.
Conclusion
Understanding what is supply zone and demand zone is a requirement for any serious technical trader in 2026. By shifting your focus from “lagging” indicator lines to the “leading” origin of institutional imbalance, traders often use these zones to study areas where price previously reacted.
Supply and demand in trading is not about predicting the future; it is about recognizing where the heavy footprint of large market participants has left its unfilled orders. Practice identifying “Fresh Rally-Base-Drop” and “Drop-Base-Rally” patterns, analyze the speed of the “Leg Out,” and you will find yourself aligning analyzis with observed price behavior.
Do You Find This Interesting?
We’d Love to Hear from you-

Frequently Asked Questions
What are the 4 types of supply and demand zones?
Supply and demand zones are categorized into four core structures based on price action:
Demand Zones: Consist of Drop-Base-Rally (DBR) and Rally-Base-Rally (RBR), both associated with upward price movements in certain market conditions.
Supply Zones: Consist of Rally-Base-Drop (RBD) and Drop-Base-Drop (DBD), both associated with downward price movements in certain situations.
What is a supply demand zone?
Supply and demand zones are critical in price regions where major imbalances between buyers and sellers occur. These zones represent historic price flashpoints, signaling the exact levels where institutions like banks and hedge funds deployed massive capital. These concentrated orders create the structural imbalances that may conincide with changes in price direction.
How to draw a supply and demand zone?
To mark a supply zone, first identify a bearish market structure, such as a Rally-Base-Drop (RBD) or Drop-Base-Drop (DBD). Since traders sell at these levels, draw the zone from the highest wick to the lowest candle body within the consolidation area preceding the price drop.
Which timeframe is best for supply and demand?
High Timeframes (Daily/Weekly): Best for pinpointing high-probability institutional zones and significant historical turning points.
Lower Timeframes (4-Hour/1-Hour): Essential for refining precise entry triggers and monitoring real-time intraday price action.
Can supply and demand predict the future?
Supply and demand analysis is used by traders to study potential areas of price reaction, but it does not guarantee future market direction.
DISCLAIMER: Investments in the securities market are subject to market risks, read all the related documents carefully before investing. The securities quoted are exemplary and are not recommendatory. Brokerage will not exceed the SEBI prescribed limit.