Navia Weekly Roundup (Nov 17 – 21, 2025)

- Week in the Review
- Indices Analysis
- Interactive Zone!
- Sector Spotlight
- Top Gainers and Losers
- Currency Chronicles
- Commodity Corner
- Top Blogs of the Week!
- N Coins Rewards
Week in the Review
The Indian equity indices extended the gains in the second consecutive week ended November 21 amid volatility led by delay in US India trade deal, uncertainty about Fed rate cut after better US non-farm payroll data, falling rupee and soft manufacturing PMI data.
Indices Analysis
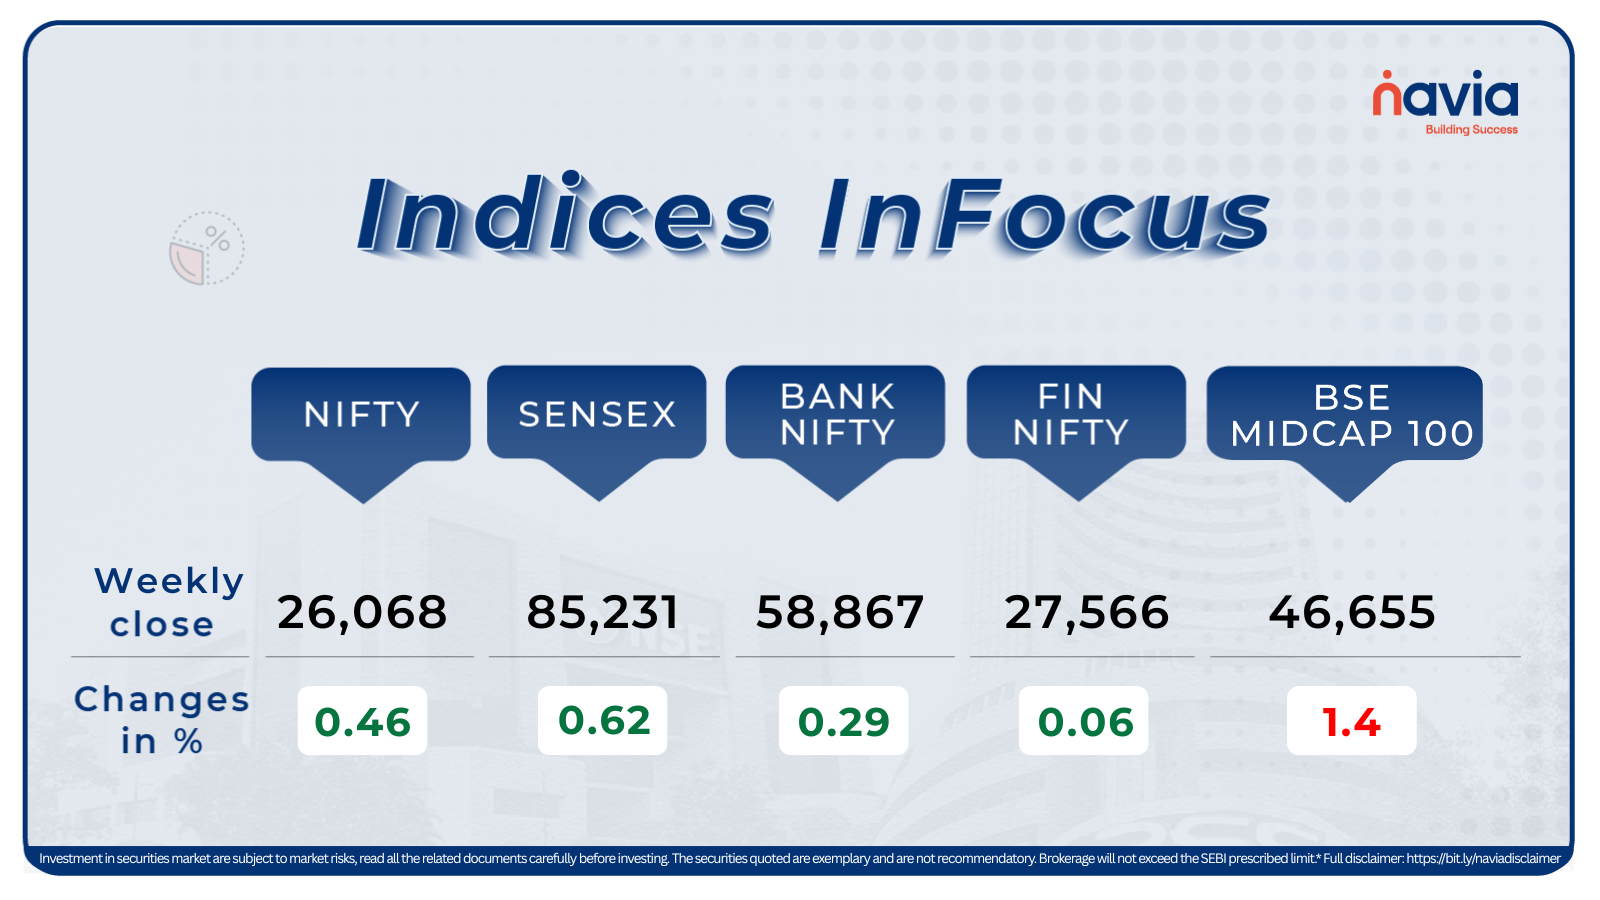
For the week, BSE Sensex index added 0.62 percent to close at 85,231.92 and Nifty50 rose 0.46 percent to finish at 26,068.15.
The BSE Large-cap Index ended with marginal gains. Hero MotoCorp, Max Healthcare Institute, Eicher Motors, Bharti Airtel, Siemens were among major gainers, while losers were Vodafone Idea, JSW Energy, Tata Motors Passenger Vehicles, Bajaj Holdings & Investment, Hindustan Zinc, Vedanta, DLF.
BSE Mid-cap Index shed 1 percent dragged by Kaynes Technology India, Supreme Industries, Bharat Dynamics, Star Health & Allied Insurance Company, Tube Investments of India, Kansai Nerolac Paints, however, gainers included Mahindra and Mahindra Financial Services, GMR Airports, 360 One Wam, PB Fintech, LT Technology Services, Hexaware Technologies.
The BSE Small-cap index declined 2 percent with Fischer Medical Ventures, Spectrum Electrical Industries, RIR Power Electronics, Jai Balaji Industries, Websol Energy System, Deccan Cements falling between 15-30 percent, while gainers were Astec Lifesciences, Sri Adhikari Brothers Television, VLS Finance, 5paisa Capital, VL E-Governance and IT Solutions and Narayana Hrudayalaya.
The Foreign Institutional Investors’ (FIIs) reduced its selling in this week as they sold equities worth Rs 188 crore, while Domestic Institutional Investors (DII) continued their buying as they bought equities worth Rs 12,969.03 crore.
Interactive Zone!
Test your knowledge with our Markets Quiz! React to the options and see how your answer stacks up against others. Ready to take a guess?
Sector Spotlight
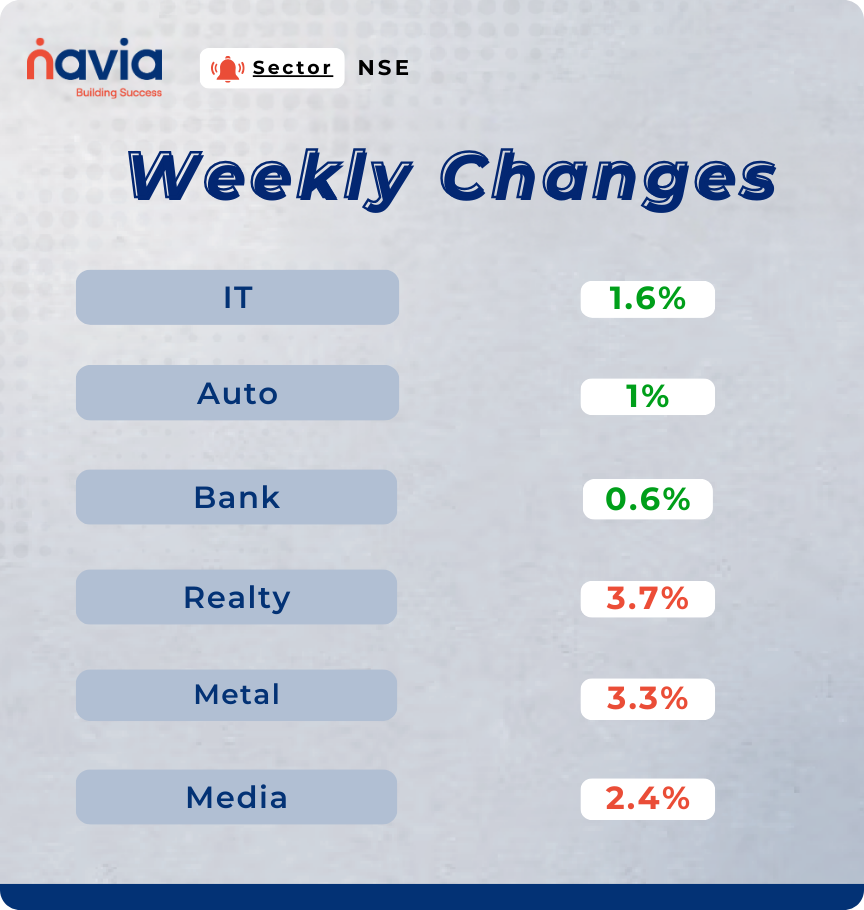
On the sectoral front, Nifty IT index surged 1.6%, Nifty Auto index added 1%, Nifty Bank index rose 0.6%, on the other hand, Nifty Realty index fell 3.7%, Nifty Metal index fell 3.3%, Nifty Media shed 2.4%.
Top Gainers and Losers
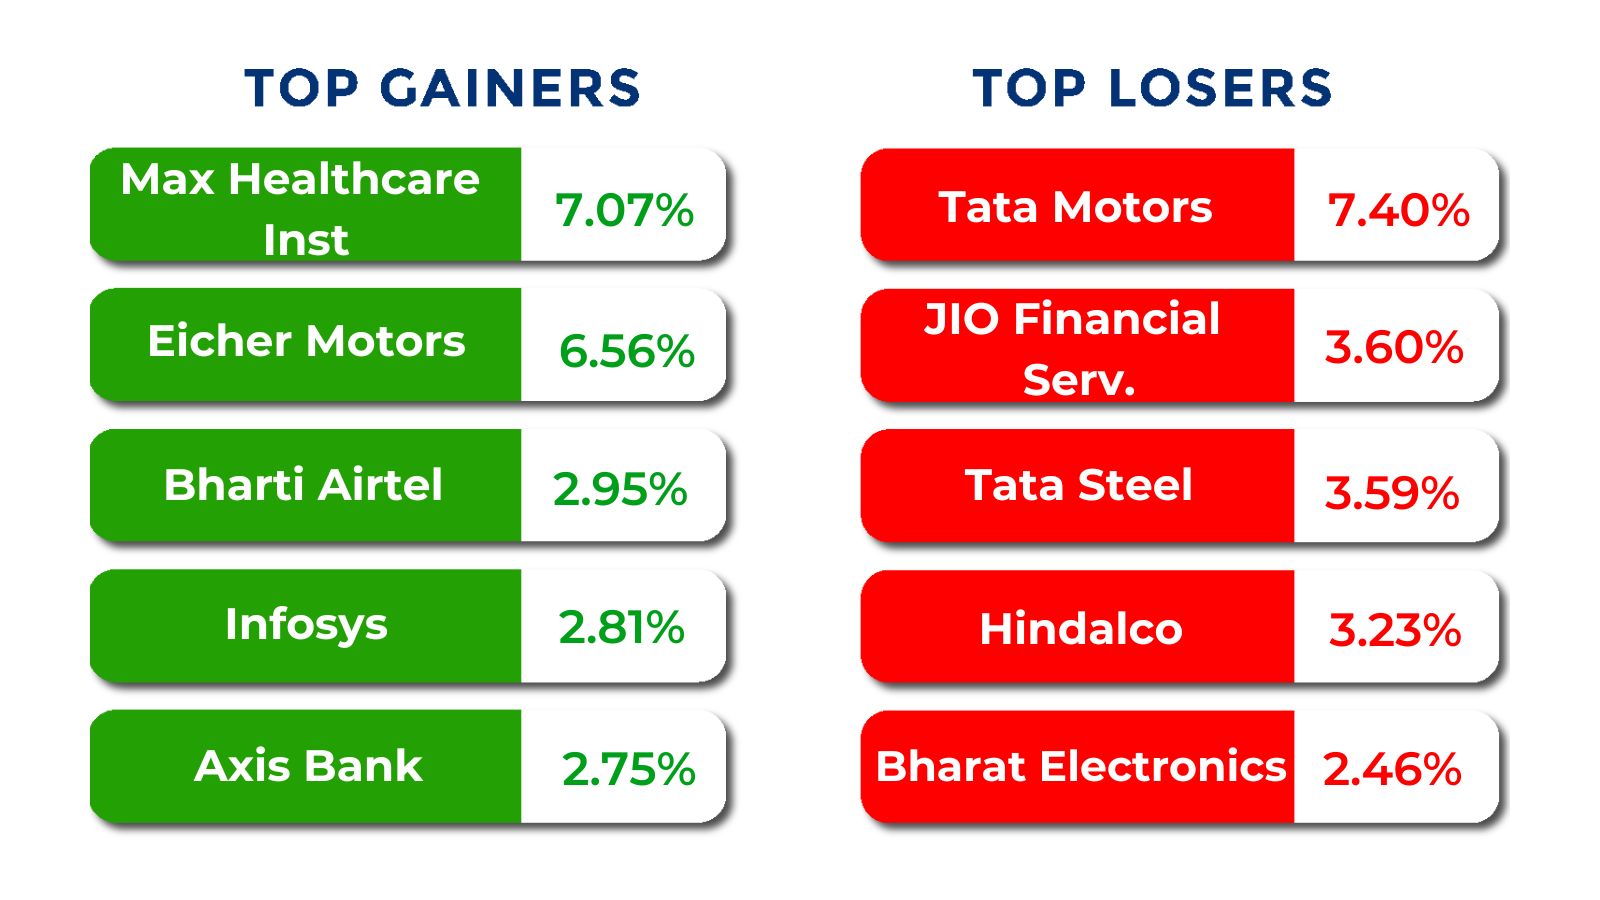
Currency Chronicles
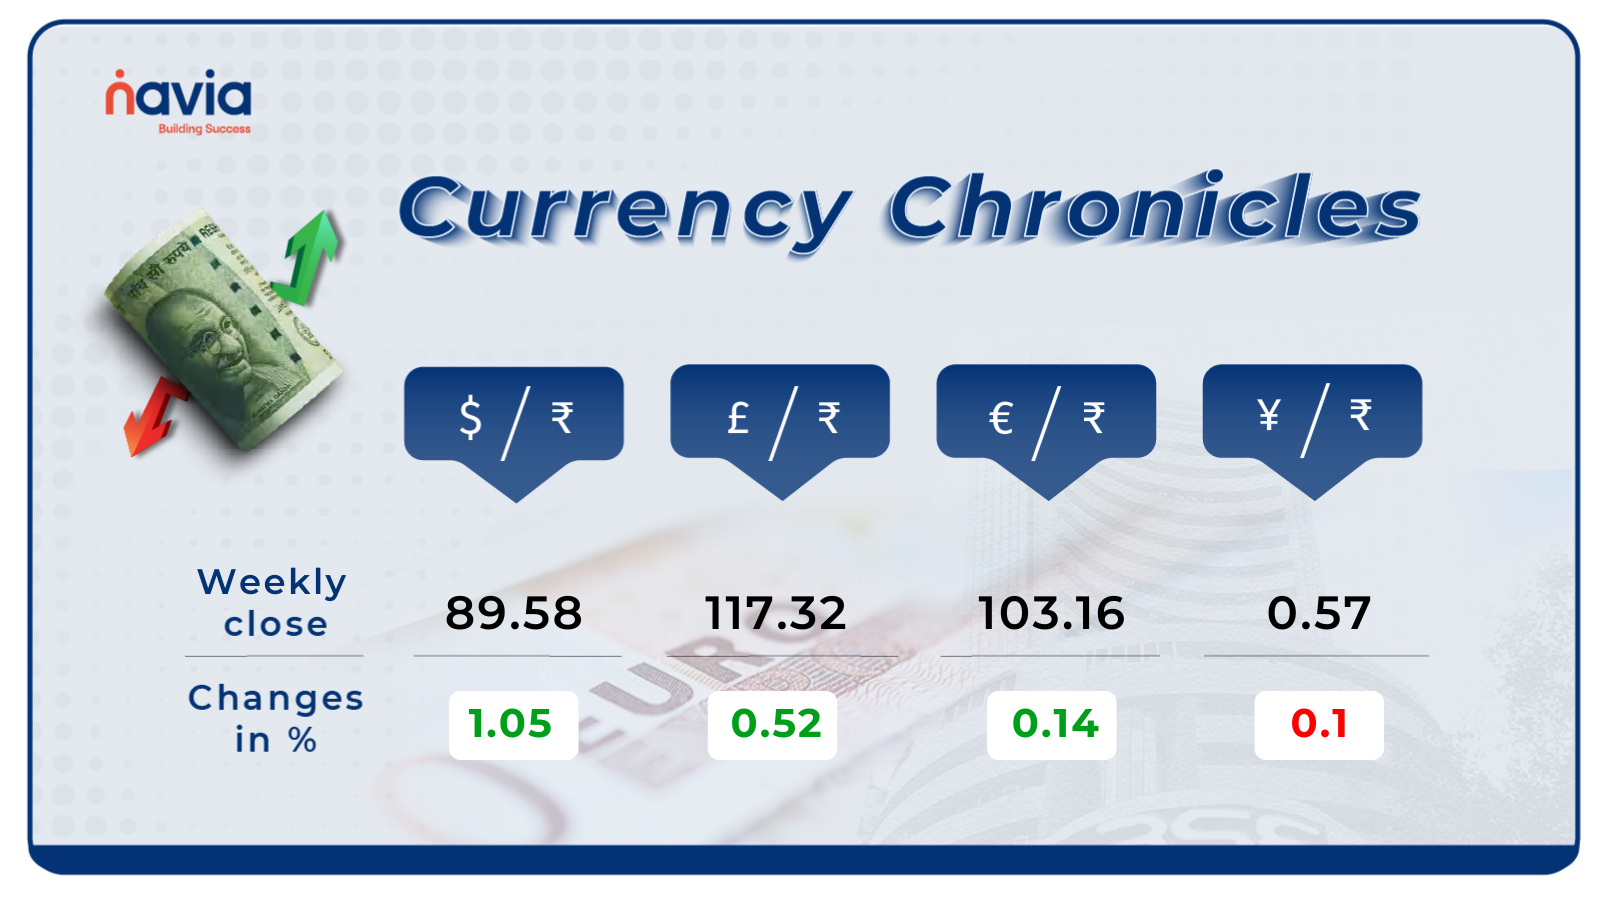
USD/INR:
The USD/INR rate closed at ₹89.58 per dollar, gaining 1.05% during the week, reflecting a bullish market sentiment.
EUR/INR:
The EUR/INR rate closed at ₹103.16 per euro, gaining 0.14% during the week, reflecting a bullish market sentiment.
JPY/INR:
The JPY/INR rate closed at ₹0.57 per yen, losing 0.1% during the week, reflecting a bearish market sentiment.
Stay tuned for more currency insights next week!
Commodity Corner
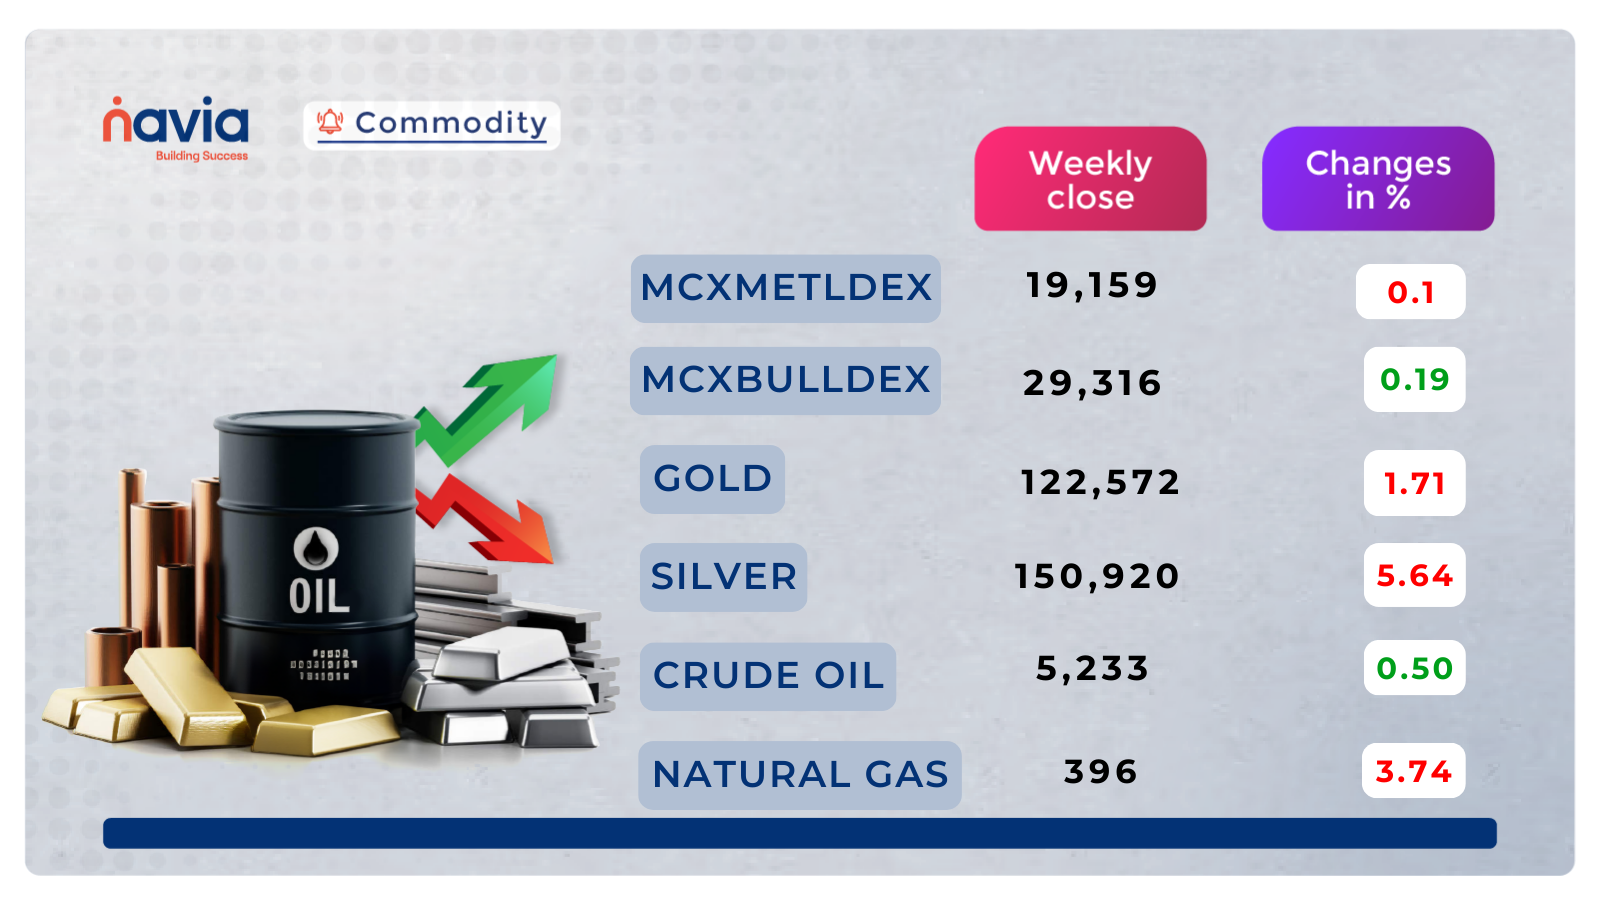
Crude oil prices continue to trade within a descending channel, indicating persistent selling pressure. The price has repeatedly failed to sustain above the upper trendline resistance, suggesting that short-term sentiment remains bearish unless a breakout occurs. The immediate resistance is placed near 5,350–5,400, aligned with the upper channel, while strong supply exists at 5,511. On the downside, the lower channel support near 5,050–5,000 remains a key demand zone. A breakdown below this zone could trigger further downside, while intraday bounce trades are possible only near support with strict stop-losses. Despite mild demand improvements from global inventory expectations, the technical structure stays weak, favoring sell on rise as long as prices stay below the upper channel. Traders should remain cautious and follow strict levels with risk management.
In the last session, Gold closed at 122,572. Gold on MCX is currently trading near 1,22,600, holding firm within a rising ascending channel, signaling continued strength in the short term. After a mild pullback from the upper trendline, prices are now consolidating near support levels, suggesting a buy-on-dips opportunity as long as the lower channel holds. The broader outlook remains constructive, supported by expectations of a weaker US dollar and persistent geopolitical uncertainty. However, traders should watch for heightened volatility ahead of the 1,25,000 resistance zone, where supply pressure may emerge. Overall, the trend remains upward, and dips towards the support zone could offer favorable risk-reward setups. Caution is advised only if prices break below 1,21,600, which may hint at a short-term trend reversal.
Natural Gas last session closed at 396, continuing their strong bullish momentum after a clean breakout above the major resistance zones at 363 and 394. The price has now entered an overextended rally phase, with buyers aggressively pushing through the 407 resistance area. The structure indicates a strong uptrend, supported by higher highs and higher lows visible since the breakout from the falling channel. As long as prices hold above 394, the bulls remain firmly in control. A sustained close above 414–420 could open the next bullish leg toward 435–450. However, profit booking may emerge due to the sharp run-up, and a pullback toward 394–407 cannot be ruled out. This zone now acts as a strong support demand area. Below 394, momentum may weaken, dragging prices toward 363.
Do you have a question? Ask here and we’ll publish the information in the coming weeks.
Top Blogs of the Week!
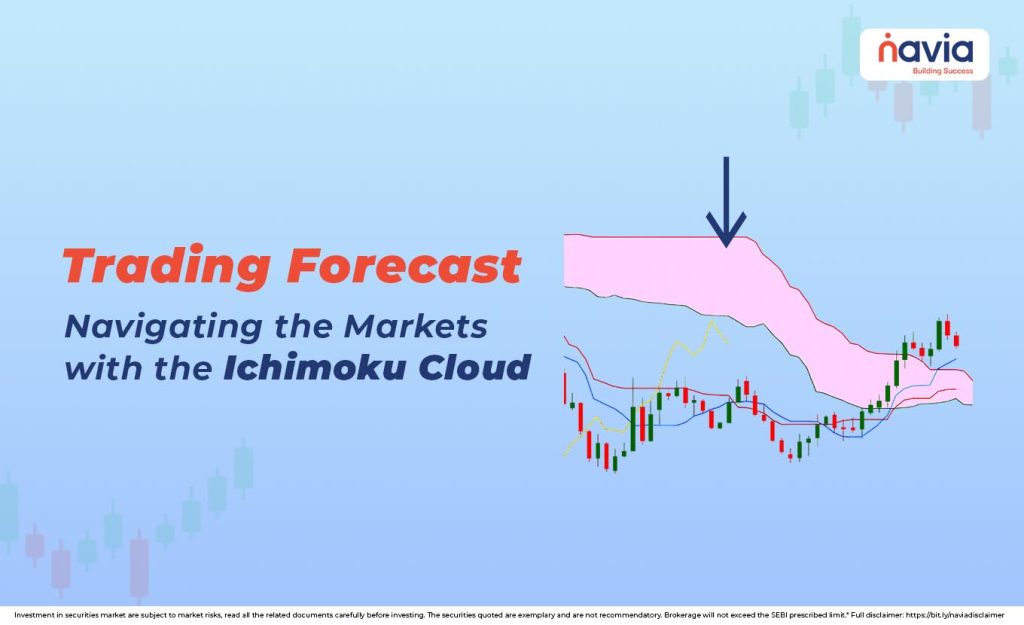
Trading Forecast: Navigating the Markets with the Ichimoku Cloud
The Ichimoku Cloud (Kumo) is a powerful Japanese technical indicator that provides a comprehensive view of trend direction, momentum, and future support/resistance on a single chart.
The Unmistakable Signal: Understanding the Marubozu Candlestick Pattern
The Marubozu (Japanese for “bald”) is a powerful candlestick pattern defined by its complete lack of shadows or wicks, meaning the open and close prices are also the high and low prices for that period.
N Coins Rewards

Refer your Friends & Family and GET 500 N Coins.
Do You Find This Interesting?

DISCLAIMER: Investment in securities market are subject to market risks, read all the related documents carefully before investing. The securities quoted are exemplary and are not recommendatory. Full disclaimer: https://bit.ly/naviadisclaimer.