Navia Weekly Roundup ( Mar 24 – 28, 2025)
Week in the Review
Indian market extended the gains in the second consecutive week ended March 28 amid volatility due to mixed cues from global markets amid concern over upcoming US tariffs. However, persistent buying from domestic as well as foreign investors, and appreciation in rupee against the dollar, helped the market to close in positive territory.
Indices Analysis
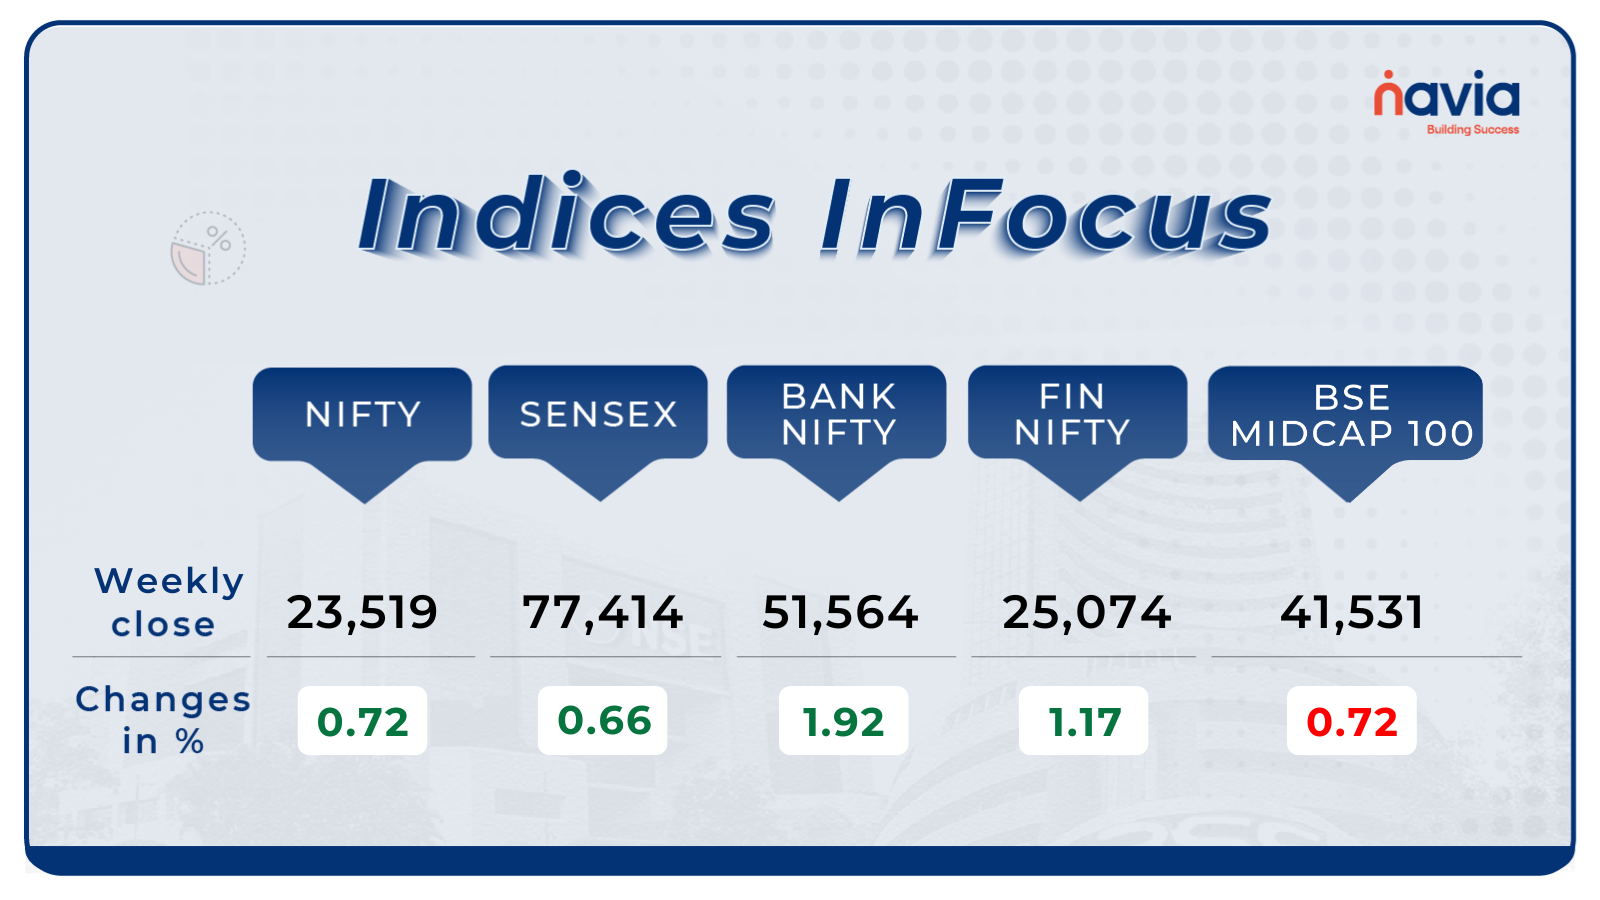
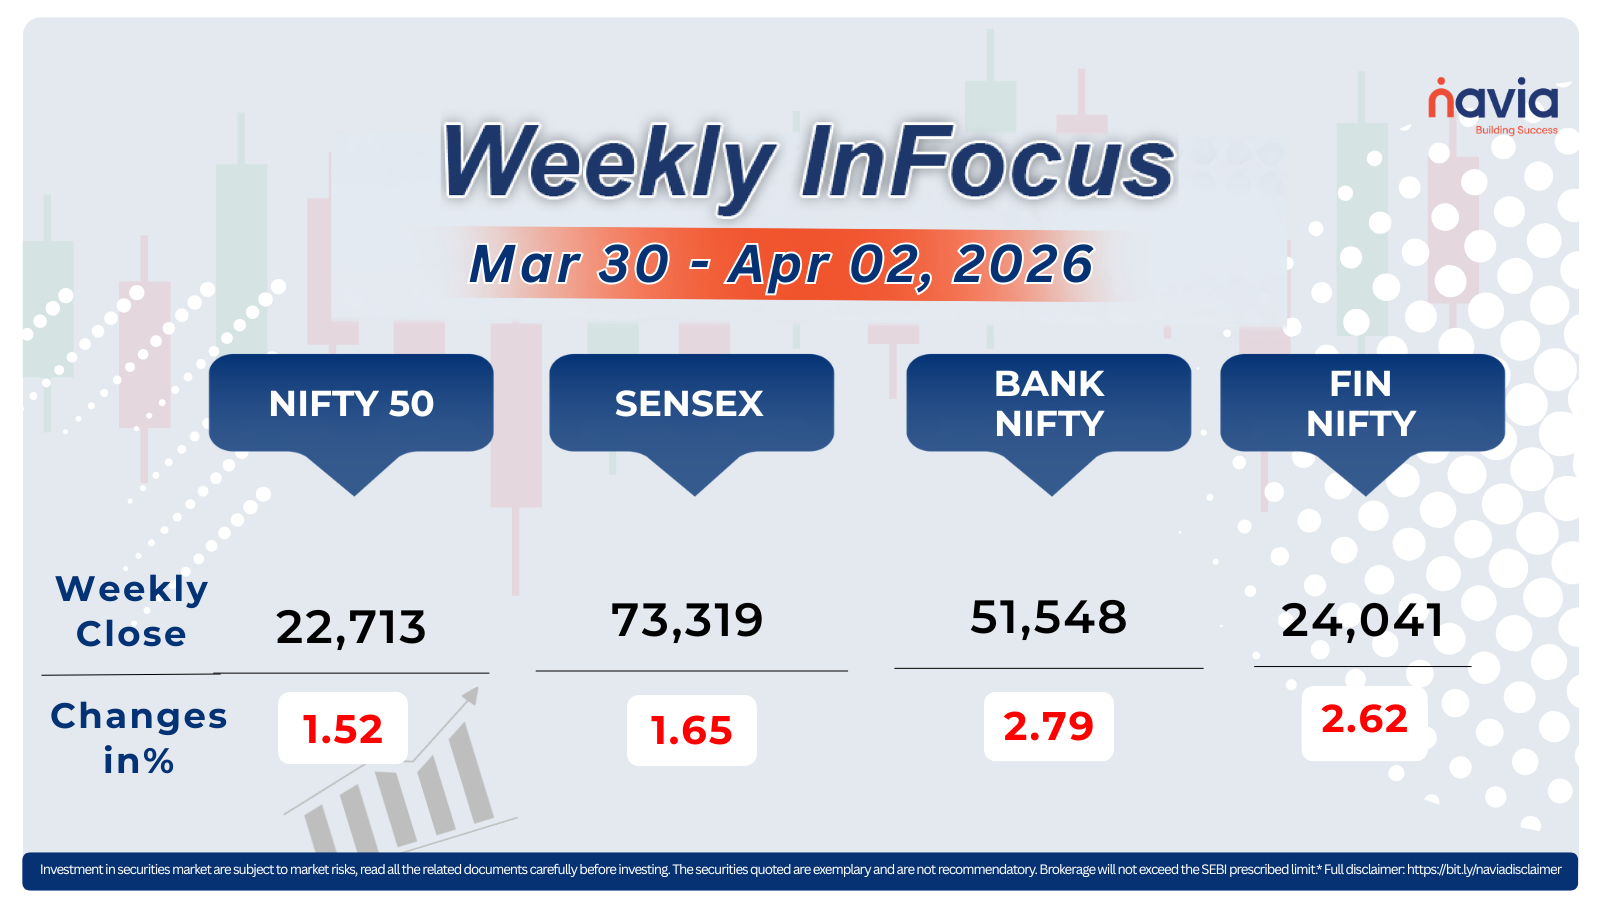
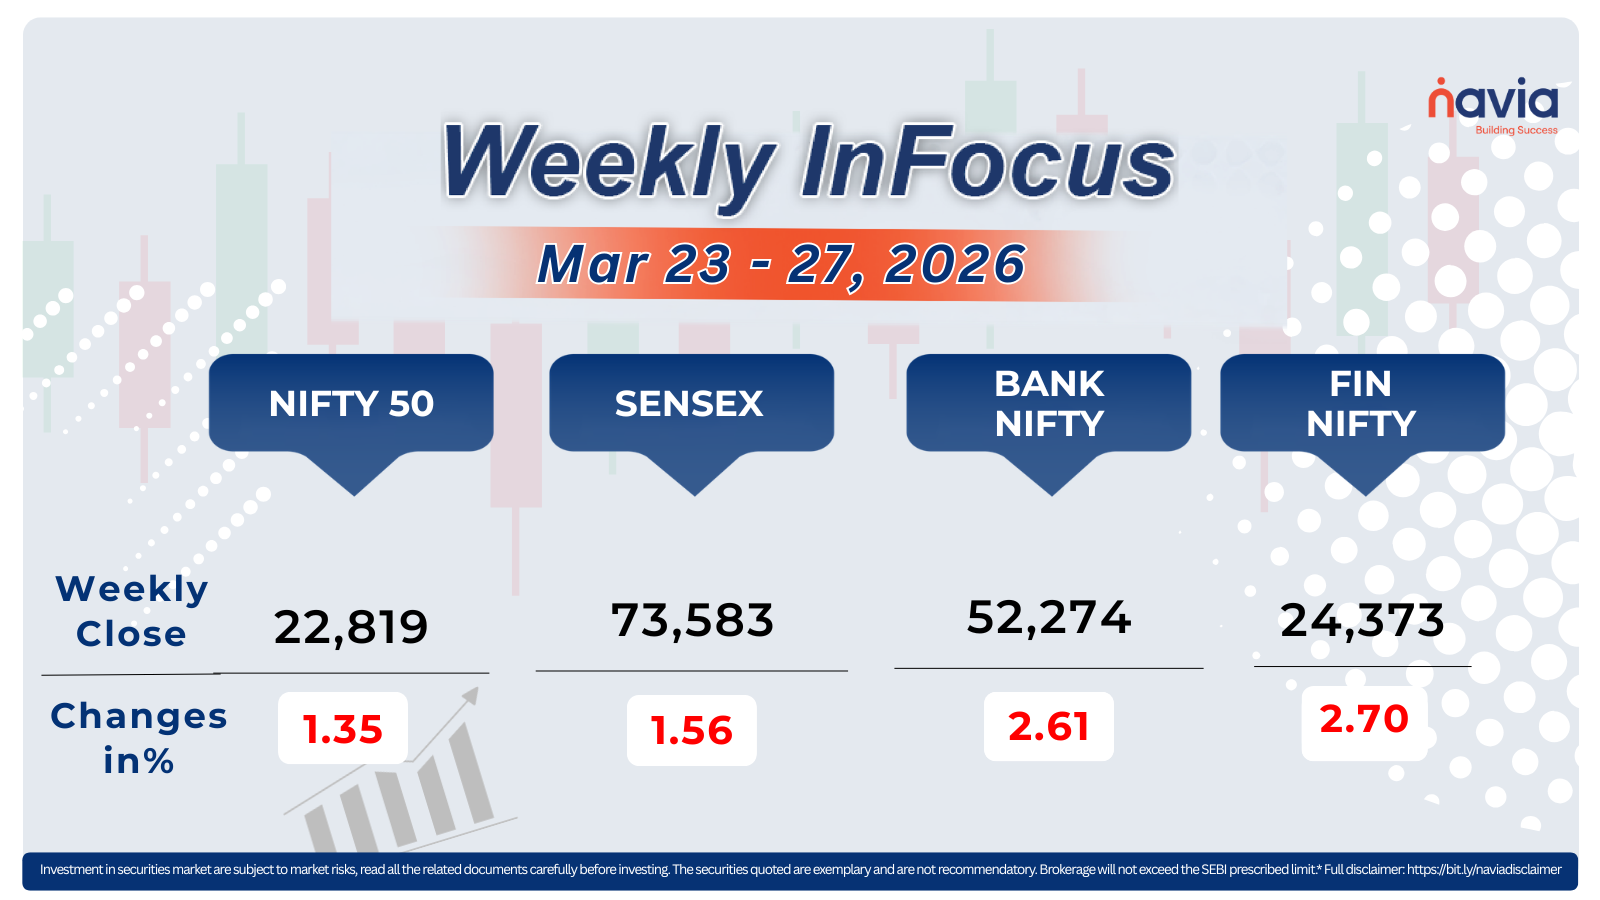
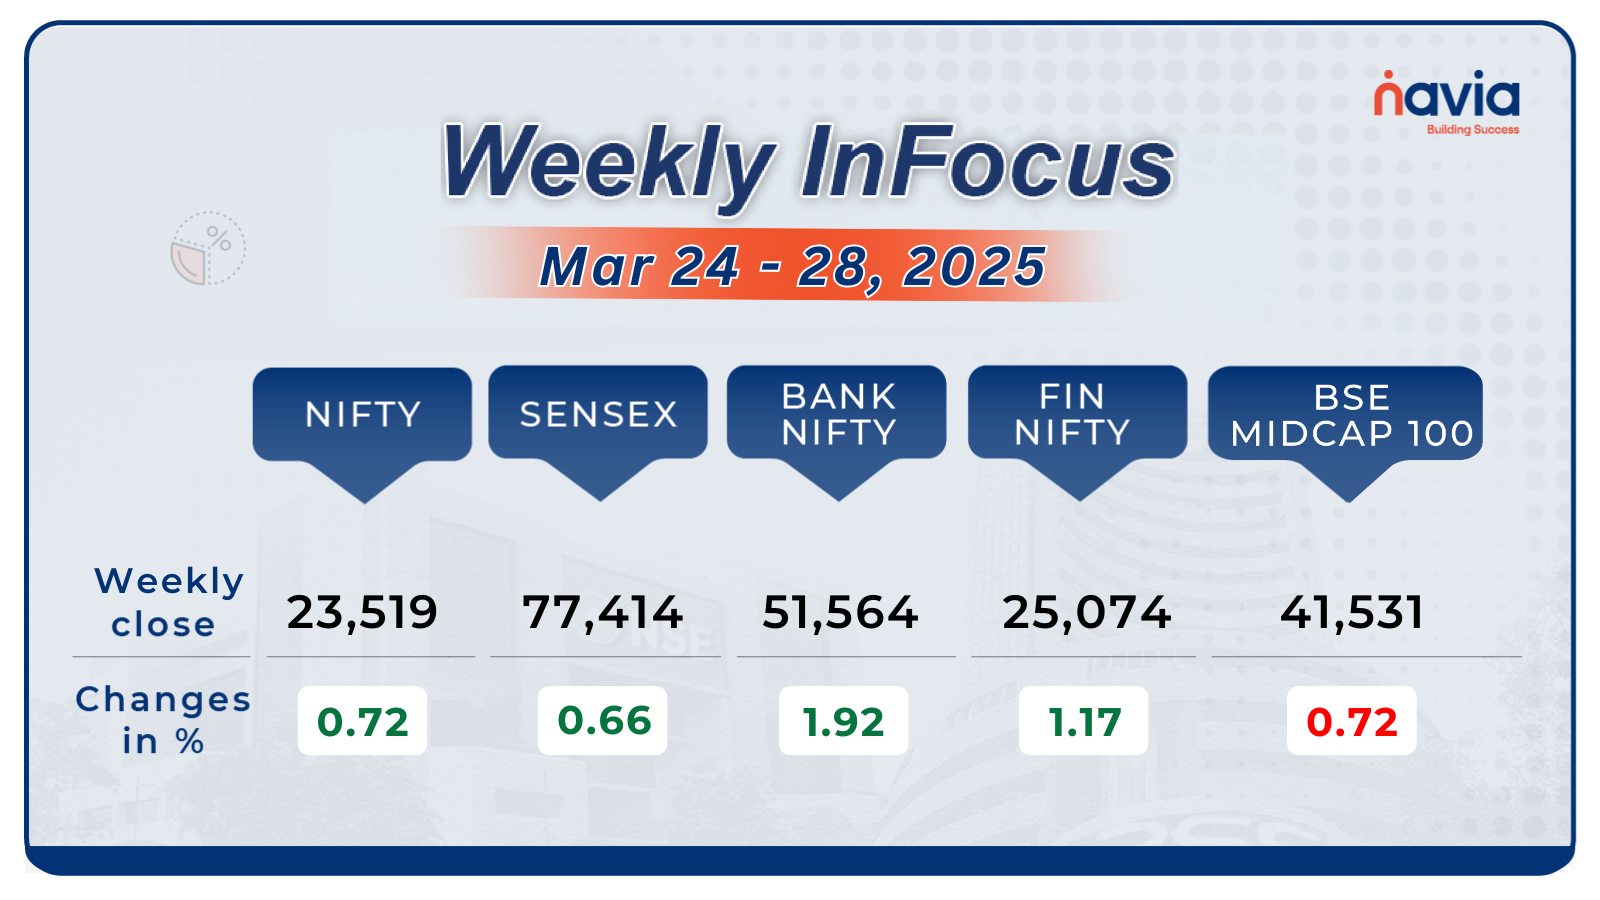
For the week, the BSE Sensex index added 509.41 points or 0.66 percent to end at 77,414.92, and Nifty50 rose 168.95 points or 0.72 percent to close at 23,519.35.
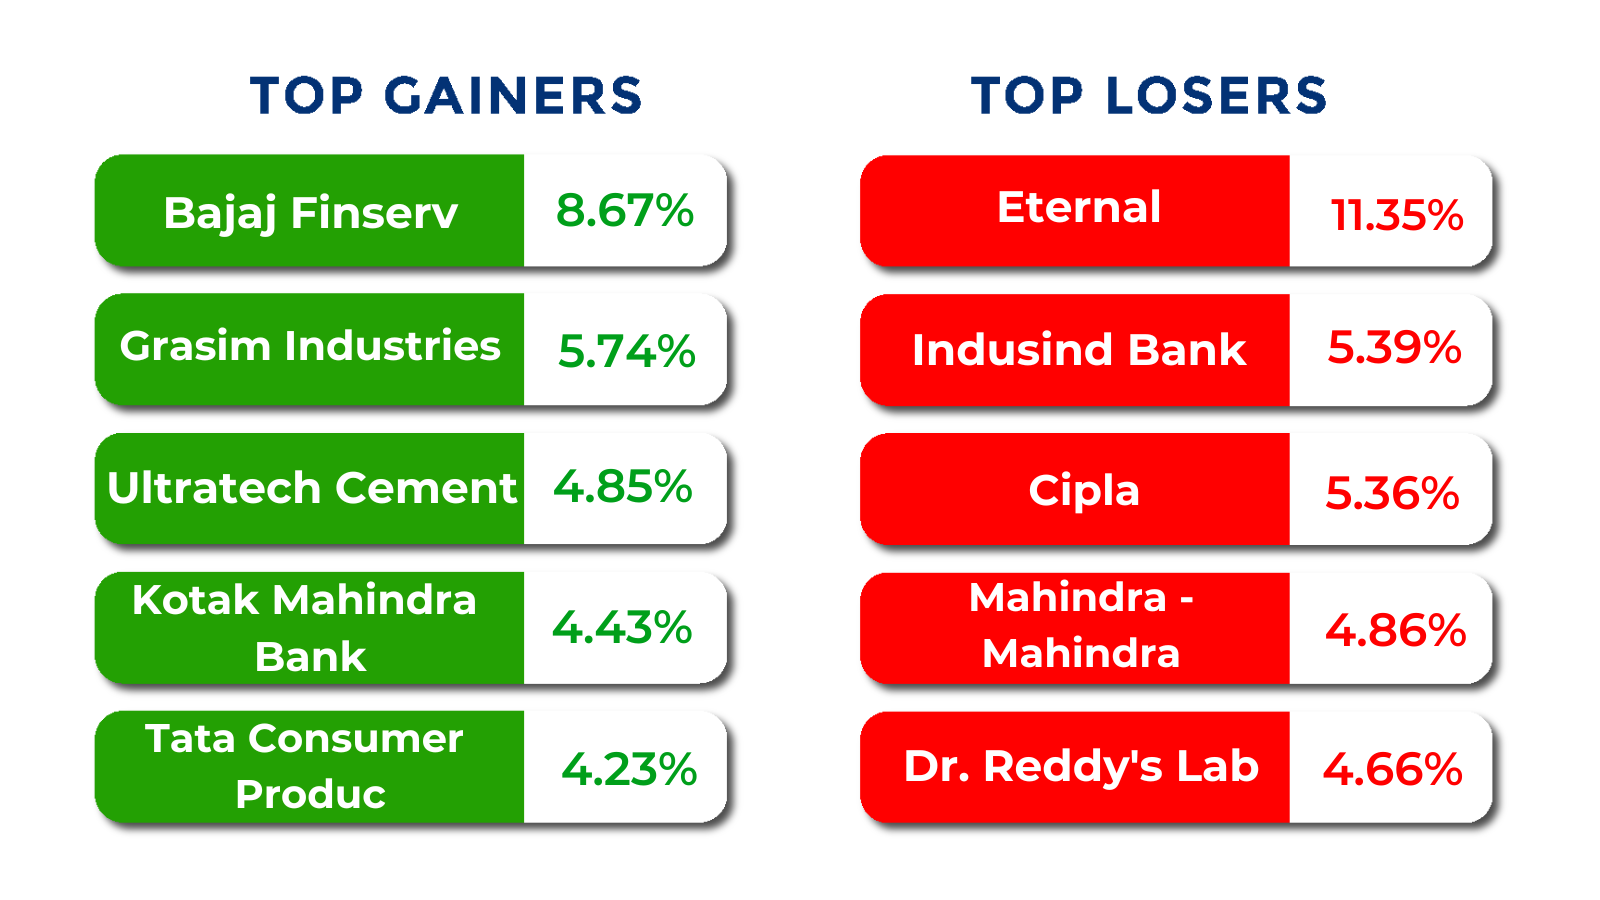
The BSE Large-cap Index rose 0.6 percent led by Bajaj Finserv, Hindustan Aeronautics, Grasim Industries, Bank Of Baroda, Shree Cements, while losers included Zomato, Indian Overseas Bank, Swiggy, Cipla, IndusInd Bank.
Interactive Zone!
Test your knowledge with our Markets Quiz! React to the options and see how your answer stacks up against others. Ready to take a guess?
Sector Spotlight
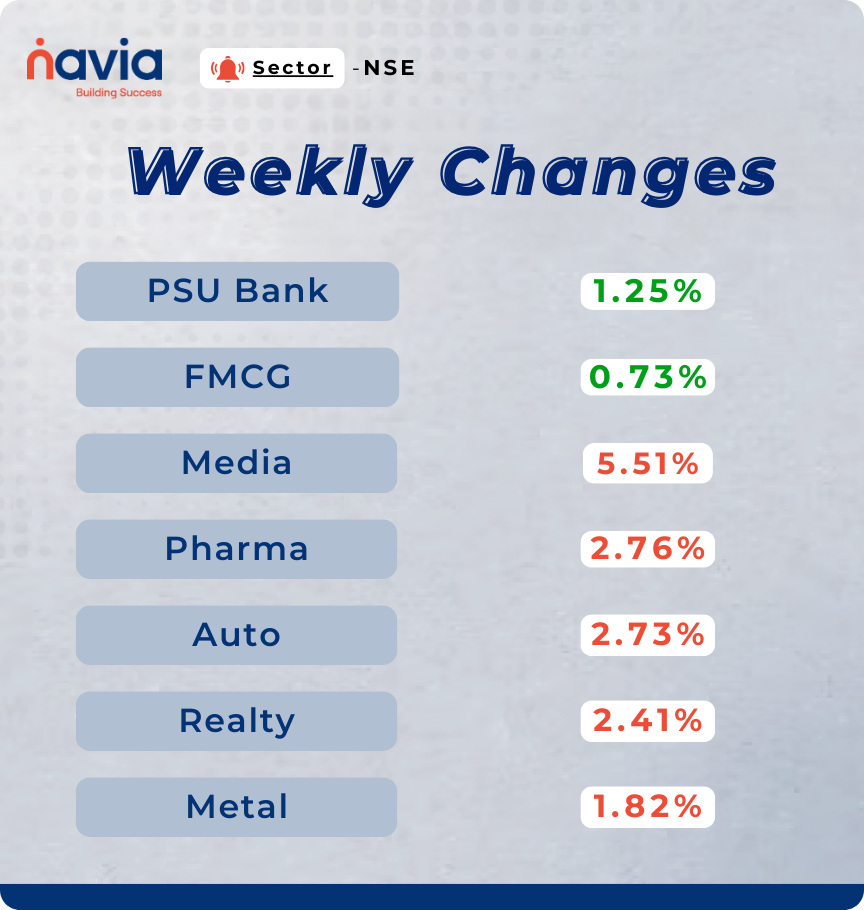
On the sectoral front, Nifty PSU Bank index added nearly 1.5 percent, Nifty FMCG index rose nearly 1 percent. On the other hand, Nifty Media shed 5.51 percent, Nifty Pharma and Auto declined more than 2 each and Nifty Realty and Metal indices shed 1 percent each.
Top Gainers and Losers
Currency Chronicles
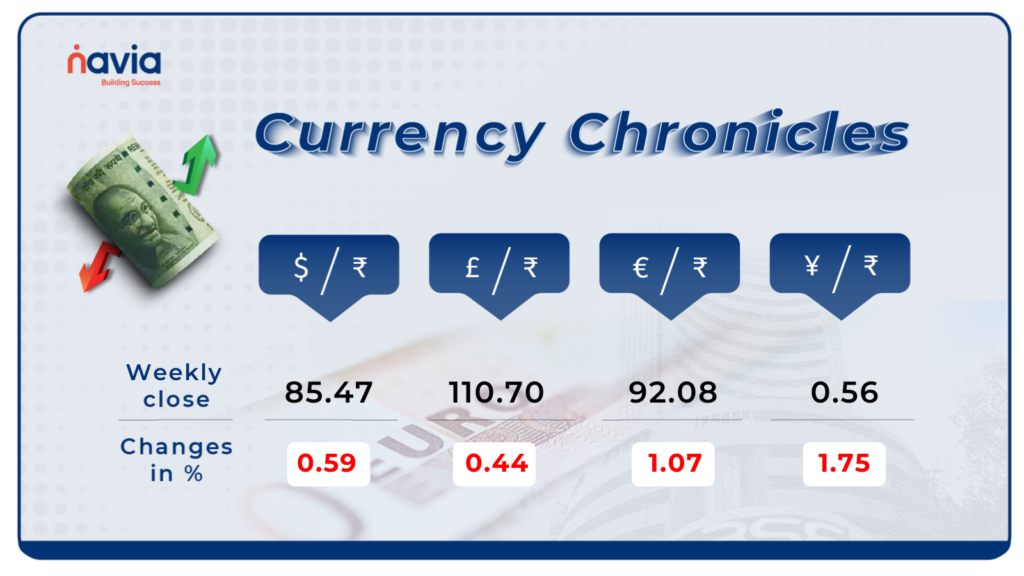
USD/INR:
The Indian rupee strengthened against the dollar, rising by 51 paise to close at ₹85.47 per dollar on March 28, compared to ₹85.97 on March 21. Currently, sentiment in the USD/INR market remains bearish.
EUR/INR:
The euro weakened by 1.07% to settle at ₹92.08 against the Indian rupee. Currently, the sentiment in the EUR/INR market remains neutral.
JPY/INR:
The Japanese yen declined by 0.75%, moving from ₹0.5709 to ₹0.56 against the Indian rupee. Currently, the sentiment in the JPY/INR market remains bearish.
Stay tuned for more currency insights next week!
Commodity Corner
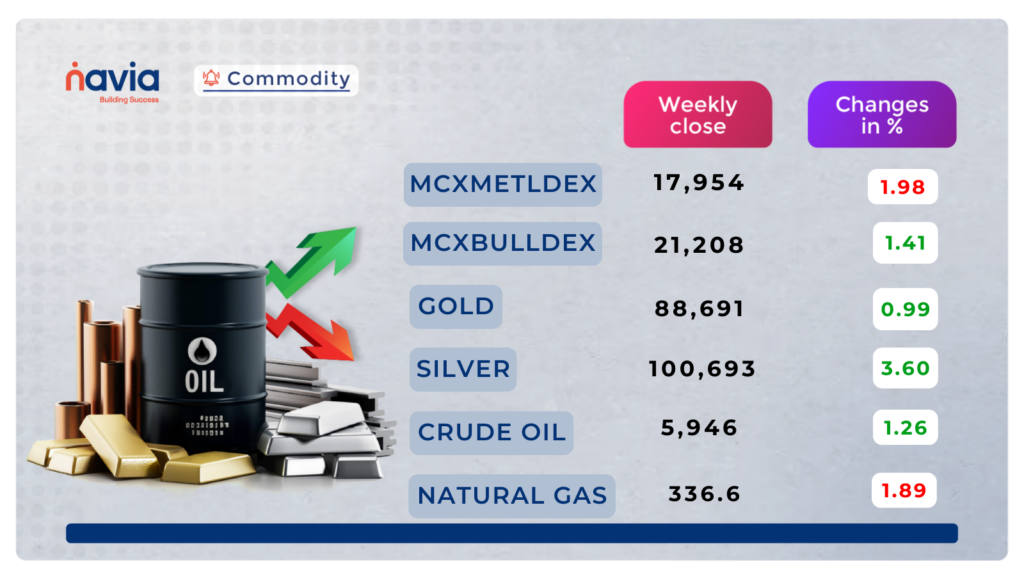
Crude oil is trading in an ascending channel pattern on the 30-minute chart, moving between resistance at 6,069 and support at 5,935. In the last session, it closed at 5,946, gaining 4 points. Further momentum is expected above 6,000 for an upside move or below 5,965 for a downside move. A potential breakout towards the upside is anticipated in the coming days.
Gold has been trading in an ascending channel on the 4-hour chart. It recently faced resistance at the upper trendline and closed at 88,691, gaining 746 points. The metal continues to trade within the channel. If gold sustains above 88,150, further upward momentum is expected. The support zone lies between 86,400–86,600, and a breakdown below this range could trigger weakness. Resistance is placed in the 90,500–90,600 range. For intraday trades, movement above 88,850 may signal an upside move, while a dip below 88,100 could lead to a downside move.
Natural gas has been consolidating over the past few days and recently broke out of a descending channel. It is currently range-bound, with resistance at 340 and support at 328. In the previous session, it closed on a positive note, gaining 7.2 points to settle at 336.6. Further momentum is expected if it breaks above 341 for an upside move or below 335 for a downside move.
Do you have a question? Ask here and we’ll publish the information in the coming weeks.
Blog of the Week!
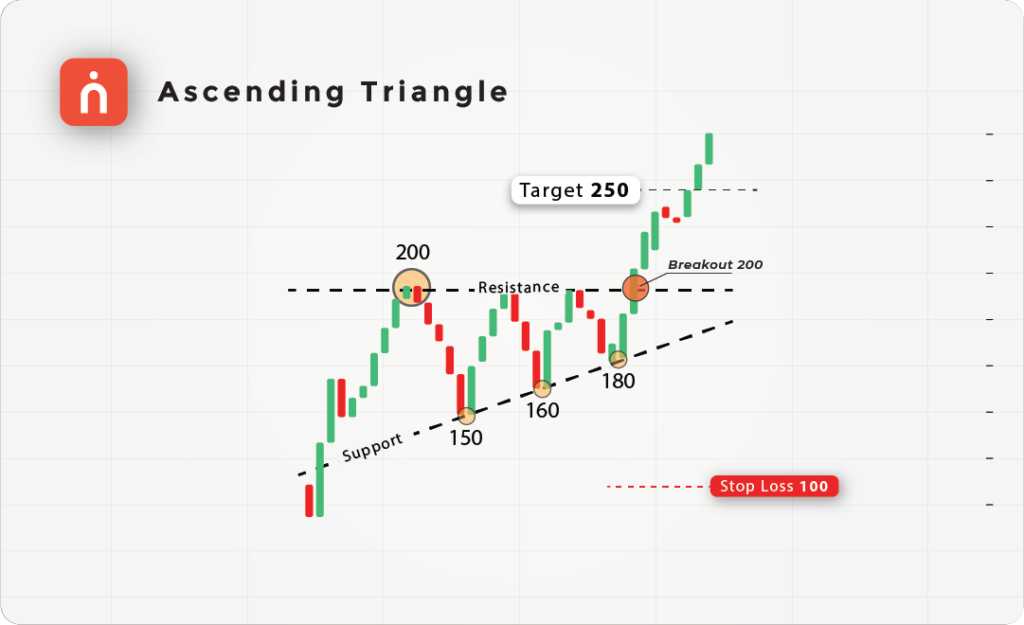
Understanding the Ascending Triangle Pattern in Technical Analysis
The powerful bullish continuation pattern signals an upcoming breakout! Spot horizontal resistance, higher lows, and volume spikes to confirm the move. Enter on breakout, set a smart stop-loss, and ride the uptrend! Learn the strategy & trade with confidence!
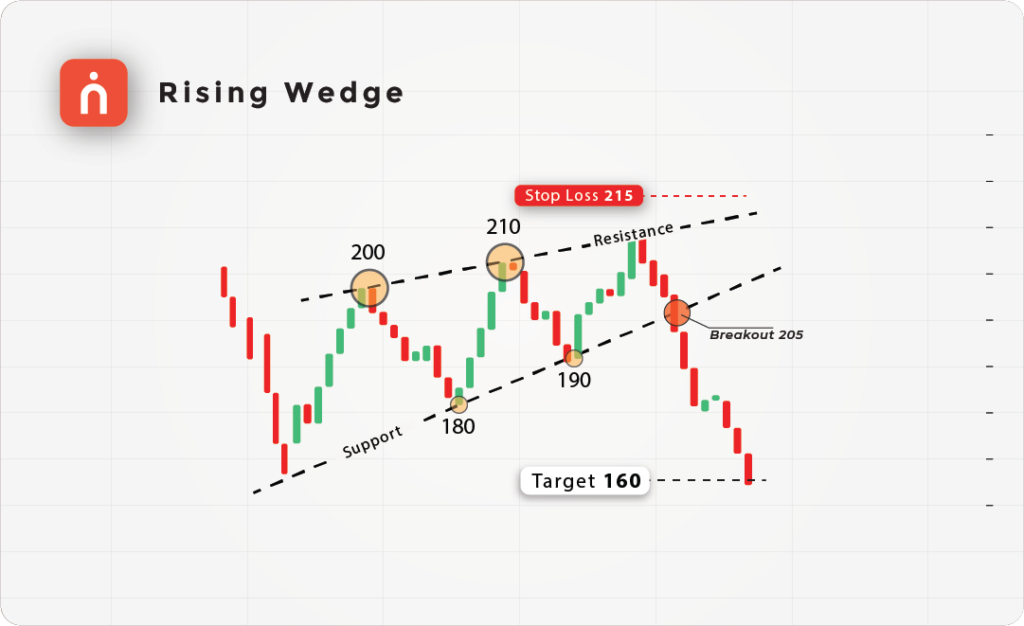
Understanding the Rising Wedge Pattern in Technical Analysis
This bearish reversal pattern warns of weakening momentum before a drop! Look for higher highs, narrowing range, and volume spikes for confirmation. Trade smart by setting a stop-loss and calculating your target price! Master the strategy & trade wisely!
N Coins Rewards

Refer your Friends & Family and GET 500 N Coins.
Do You Find This Interesting?