Navia Weekly Roundup (June 29 – July 03, 2026)
- Week in the Review
- Indices Analysis
- Interactive Zone!
- Sector Spotlight
- Top Gainers and Losers
- Currency Chronicles
- Commodity Corner
- Top Blogs of the Week!
- N Coins Rewards
Week in the Review
Indian benchmark indices extended their winning streak to a fourth consecutive session, with the Nifty 50 climbing to a two-month high, supported by softer crude oil prices amid improving prospects for a US-Iran peace arrangement and easing geopolitical tensions in the Middle East. Sentiment was further boosted by the revival of the southwest monsoon, optimism over a potential India-US trade agreement, and renewed buying by foreign institutional investors (FIIs).
Indices Analysis
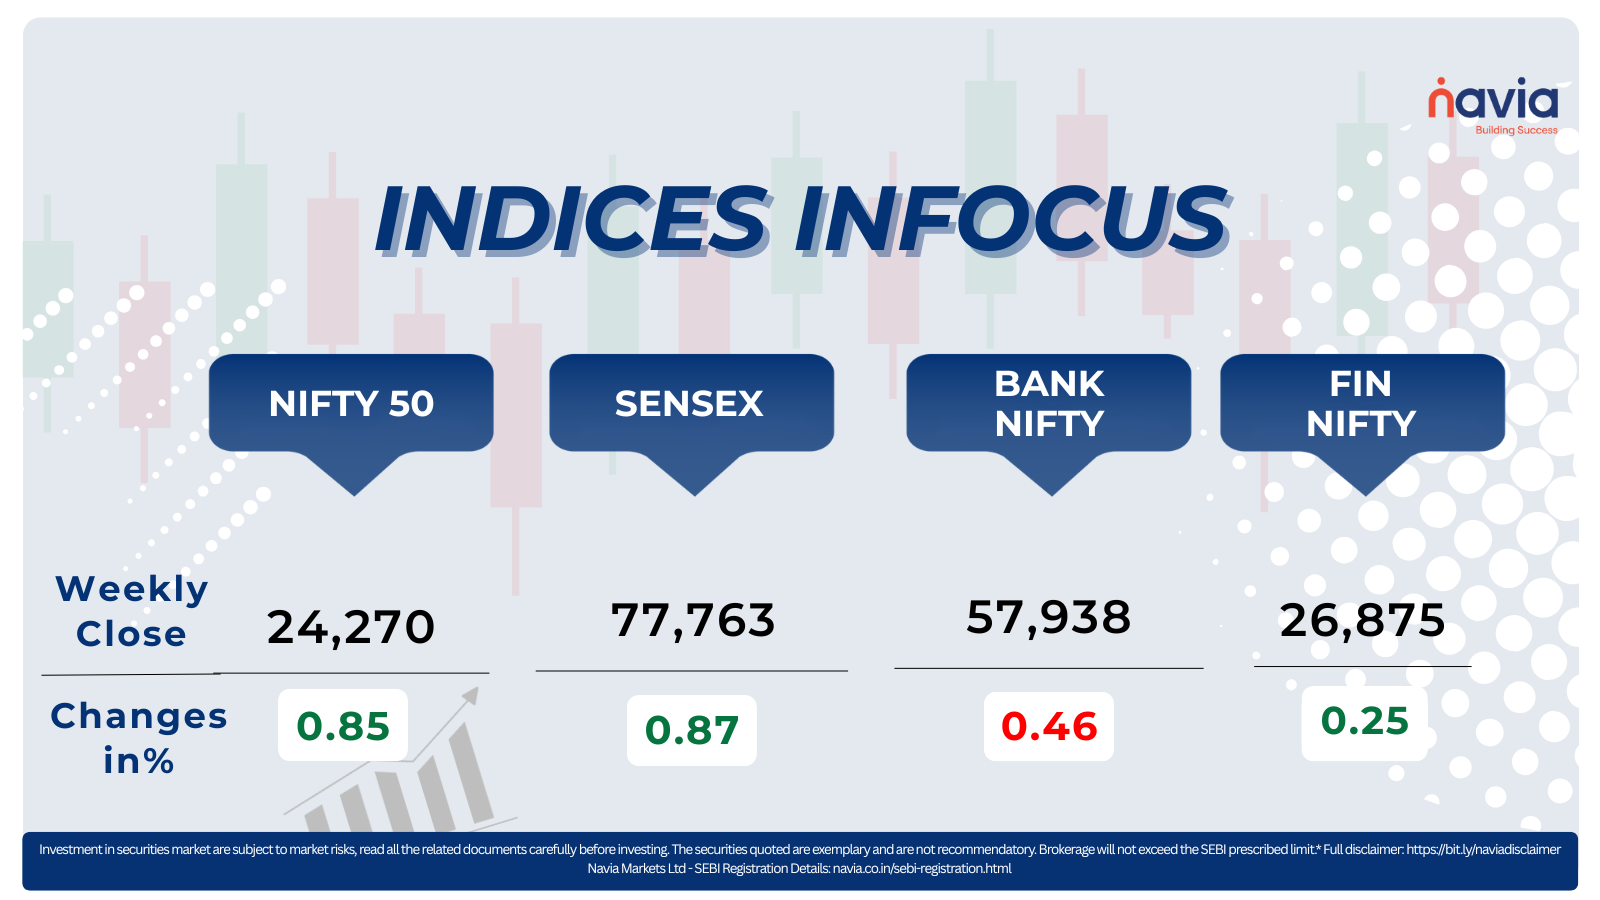
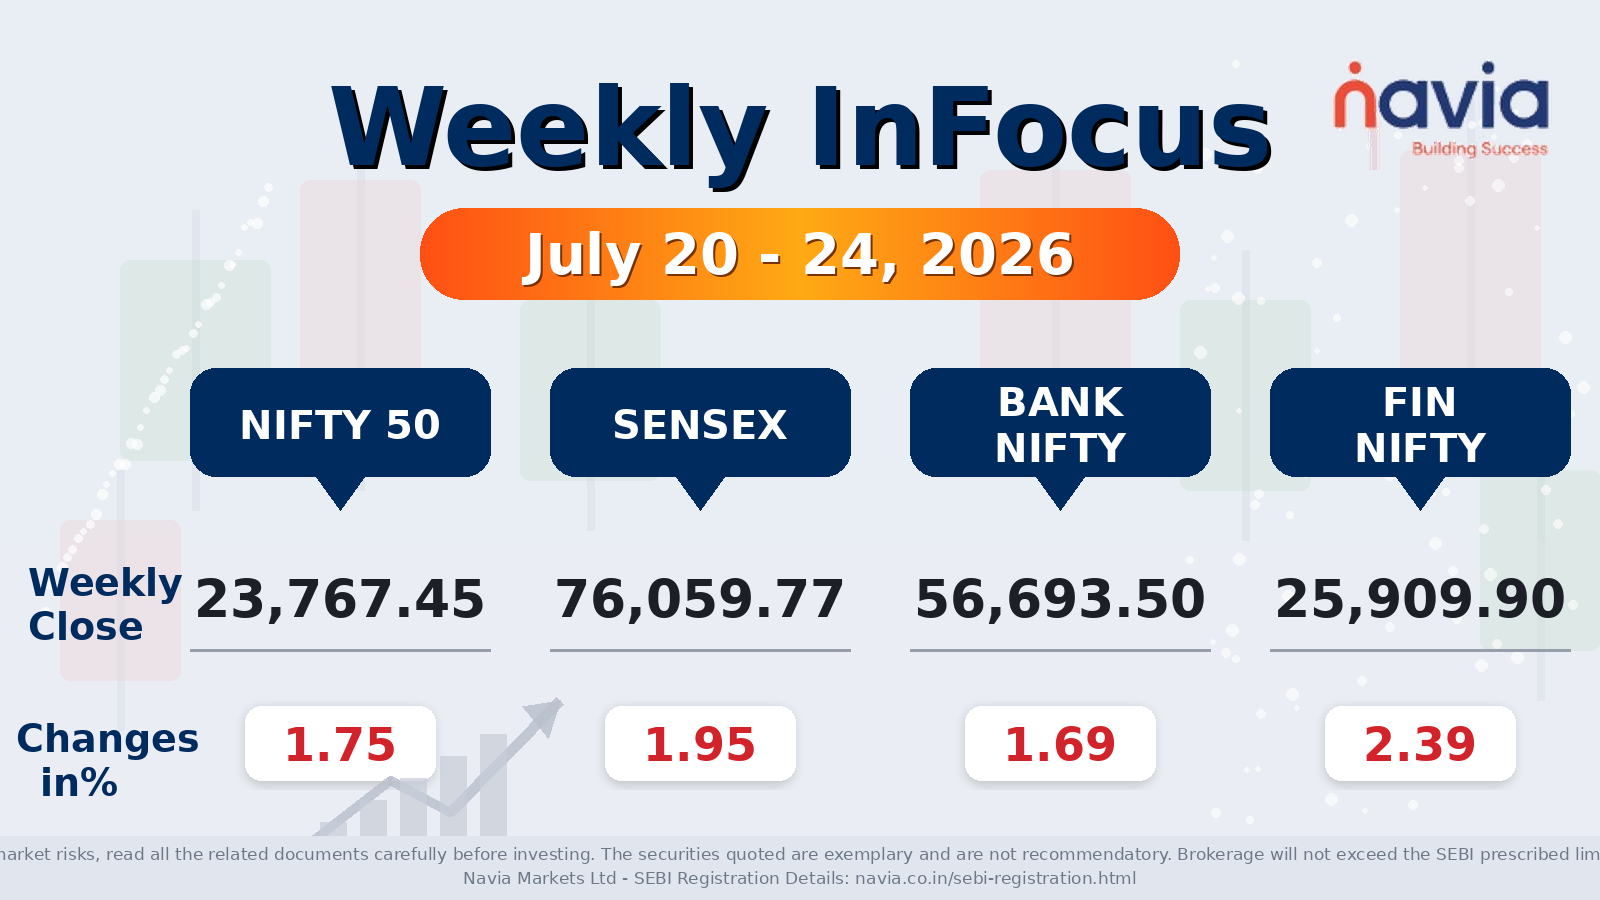
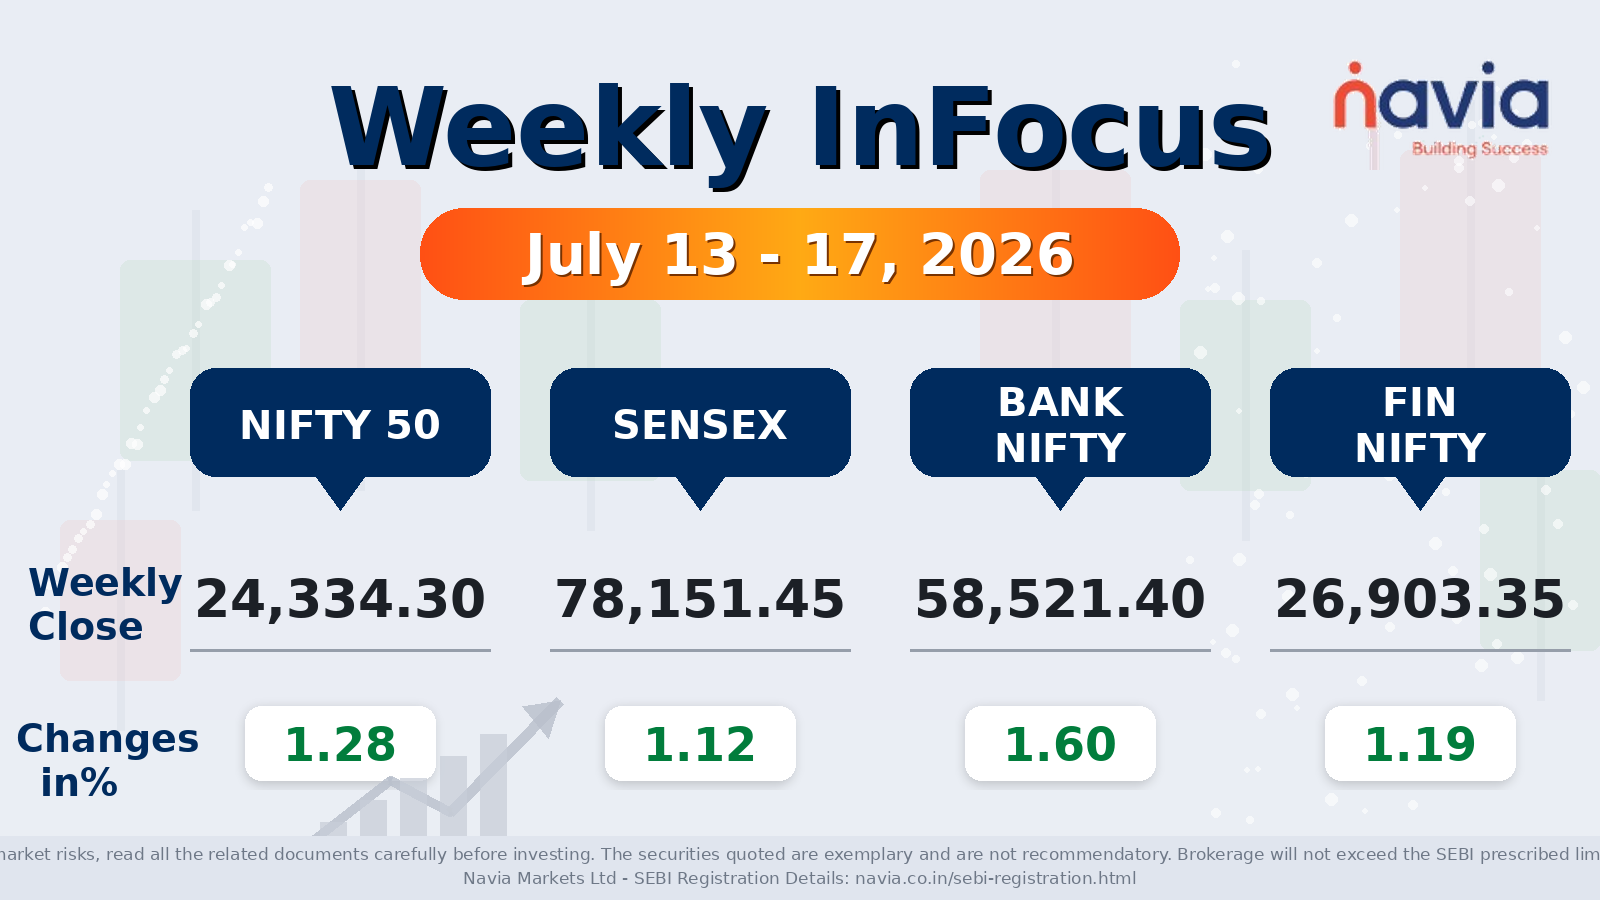
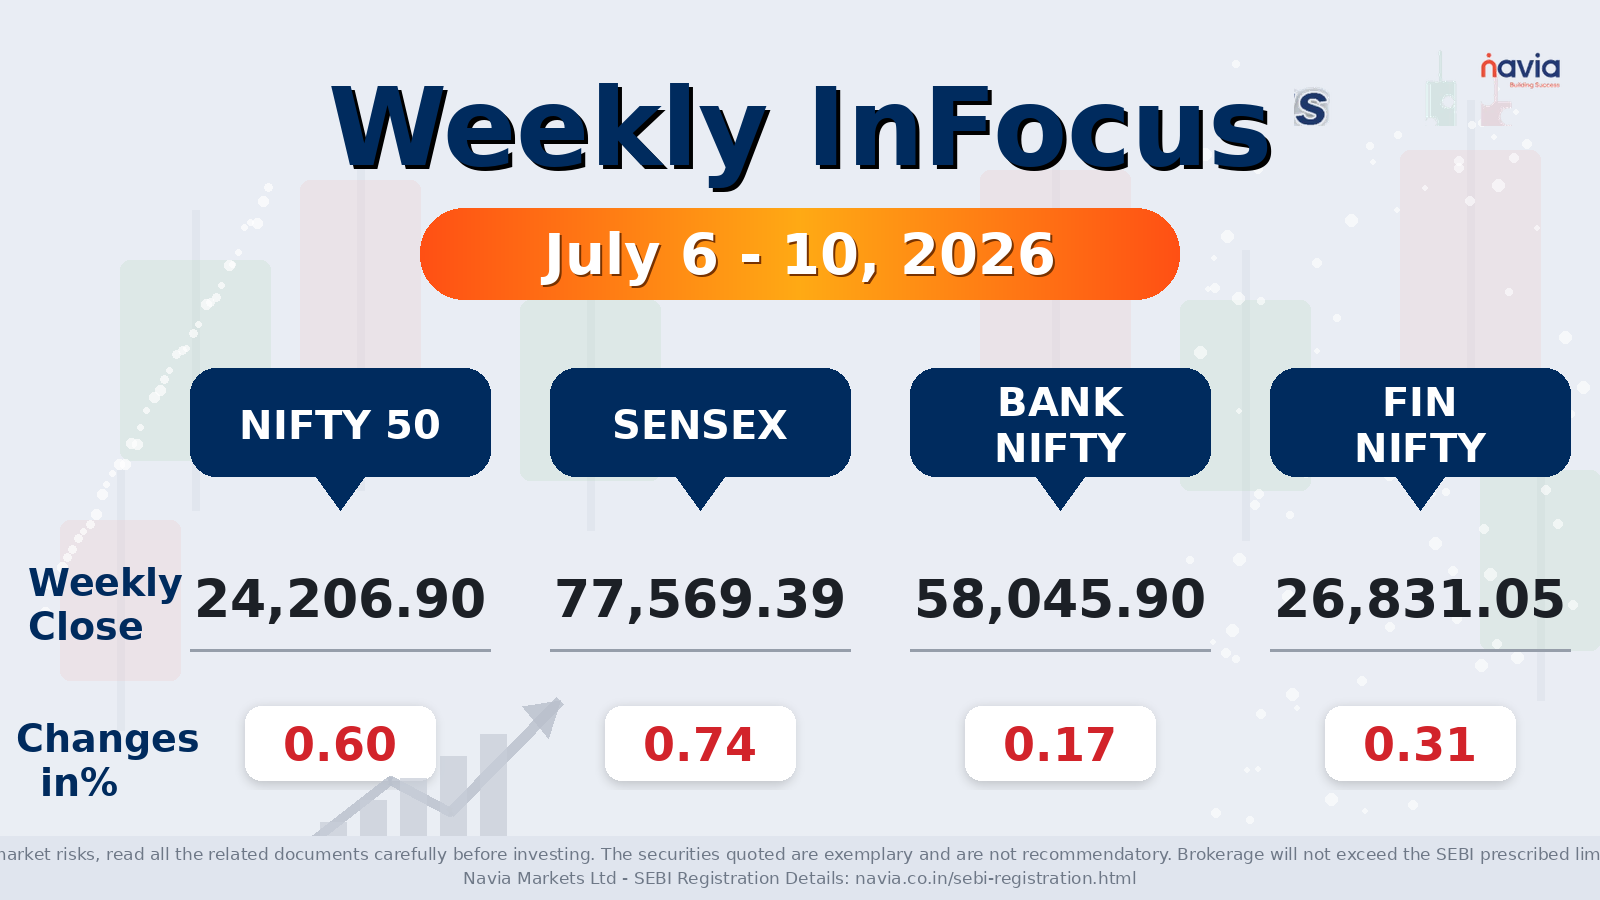
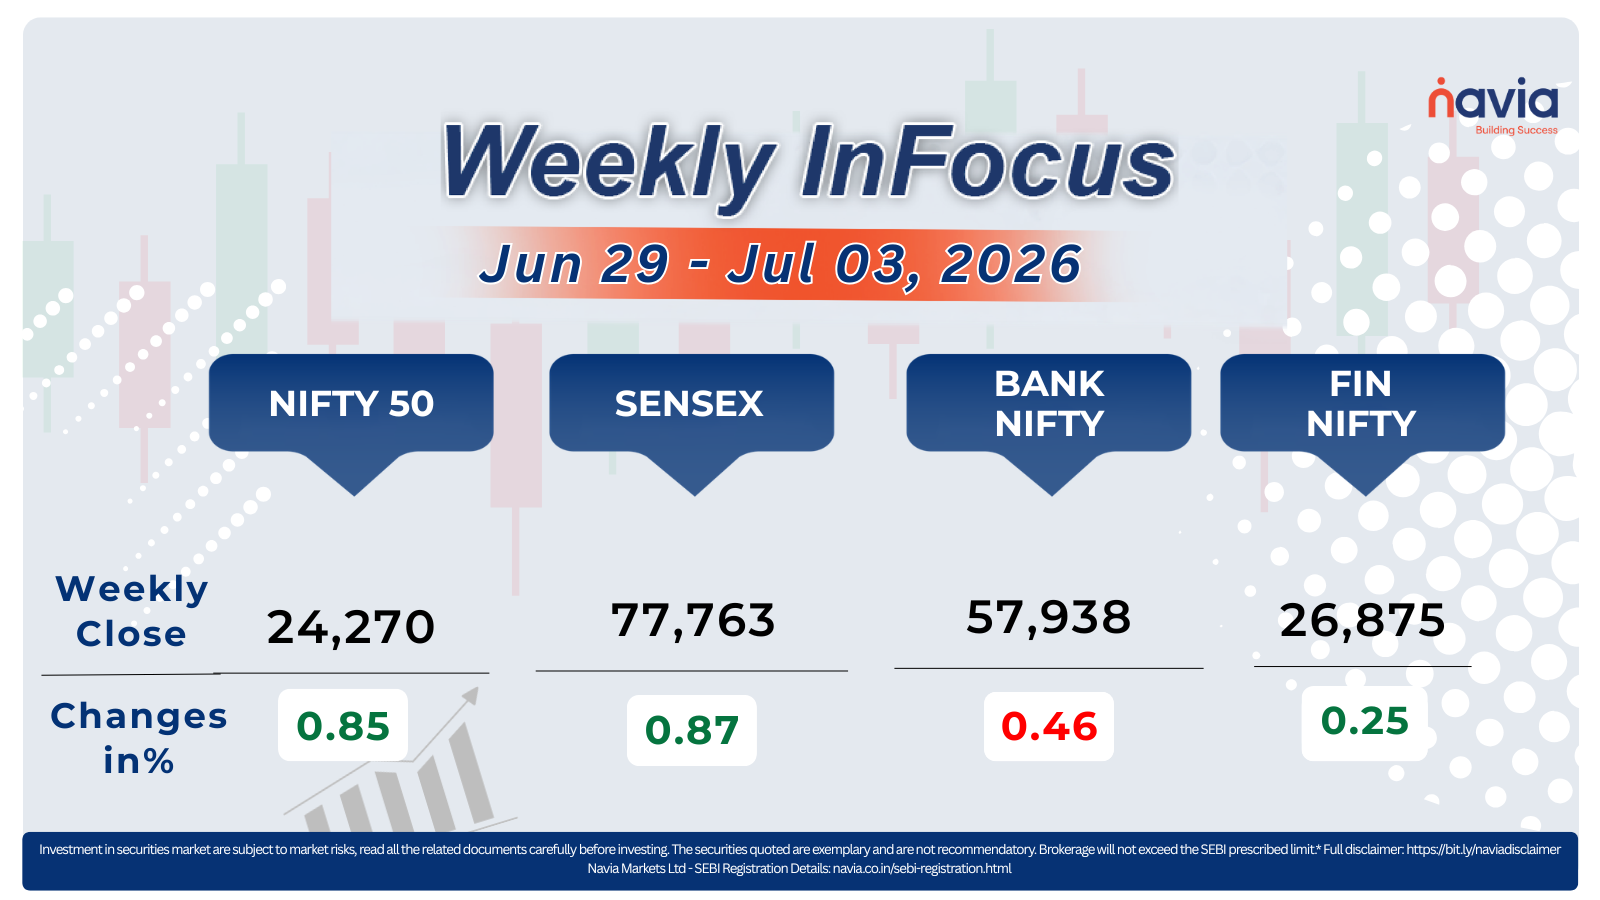
For the week, the BSE Sensex rose 0.87%, to end at 77,763.91, while the Nifty 50 added 0.85%, to close at 24,270.85.
The Nifty Midcap 100 index added 0.6 percent, led by Oberoi Realty, L&T Finance, One 97 Communications (Paytm), Godrej Properties, Phoenix Mills, and Prestige Estates Projects. On the other hand, losers were KPIT Technologies, GE Vernova TD India, Tata Elxsi, Hitachi Energy India, Astral Limited, Supreme Industries, Waaree Energies, Bharat Heavy Electricals, Tata Communications, JSW Energy, and Indian Bank.
The Nifty Smallcap 100 surged 2 percent, supported by Aegis Logistics, Zensar Technologies, Ather Energy, Five-Star Business Finance, Inventurus Knowledge Solutions, Delhivery, and City Union Bank. However, losers included Netweb Technologies India, Indraprastha Gas, Tata Chemicals, NBCC (India), Tata Technologies, and Godawari Power & Ispat.
The total market capitalisation of BSE-listed companies jumped by ₹5 lakh crore. Bharti Airtel was among the biggest contributors in terms of market value, followed by Bajaj Finance, Eternal, and Bajaj Finserv. On the other hand, Larsen and Toubro, Reliance Industries, and Kotak Mahindra Bank were among the top laggards, witnessing the sharpest erosion in market capitalisation during the week.
Foreign Institutional Investors (FIIs) continued to pare their exposure, selling equities worth around ₹4,000 crore during the week. Domestic Institutional Investors (DIIs) remained net buyers, investing ₹12,633.54 crore in equities, offsetting foreign outflows and lending support to benchmark indices.
Interactive Zone!
Test your knowledge with our Markets Quiz! React to the options and see how your answer stacks up against others. Ready to take a guess?
Sector Spotlight
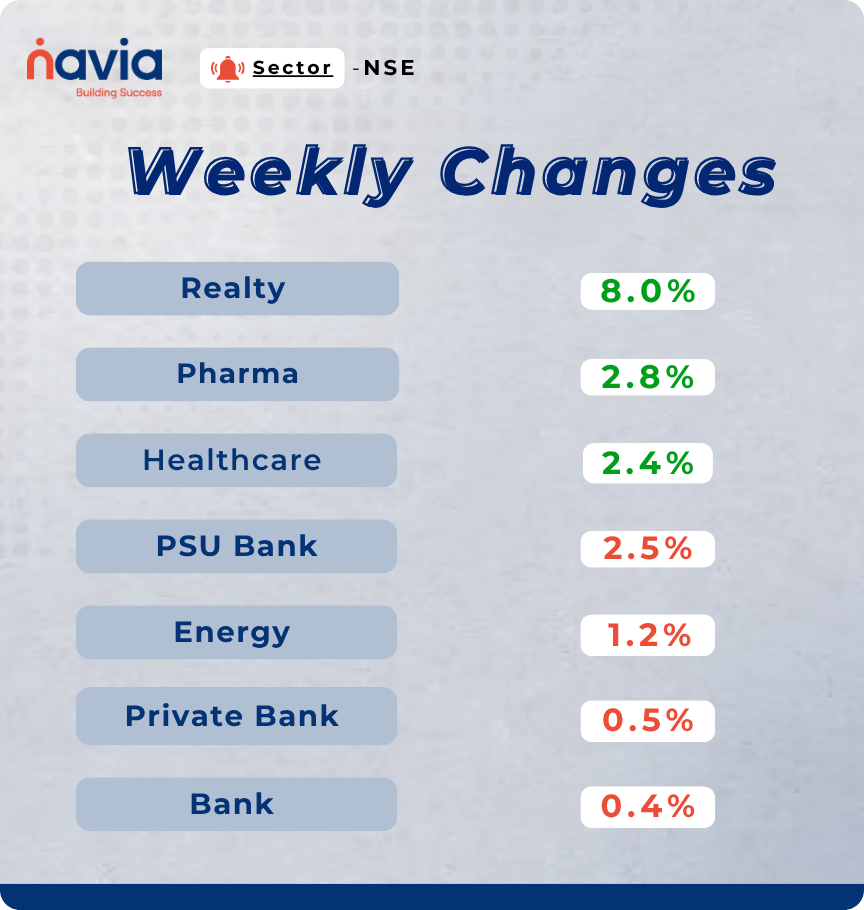
Sectoral performance remained broadly positive during the week, with most indices ending in the green. The Nifty Realty index emerged as the top performer, surging 8%, followed by the Nifty Pharma and Nifty Healthcare indices, which gained around 3% each. On the flip side, the Nifty PSU Bank index was the biggest laggard, declining 2.5%, while the Nifty Energy index slipped 1.2%. The Nifty Bank and Nifty Private Bank indices also ended lower, shedding near 1% each.
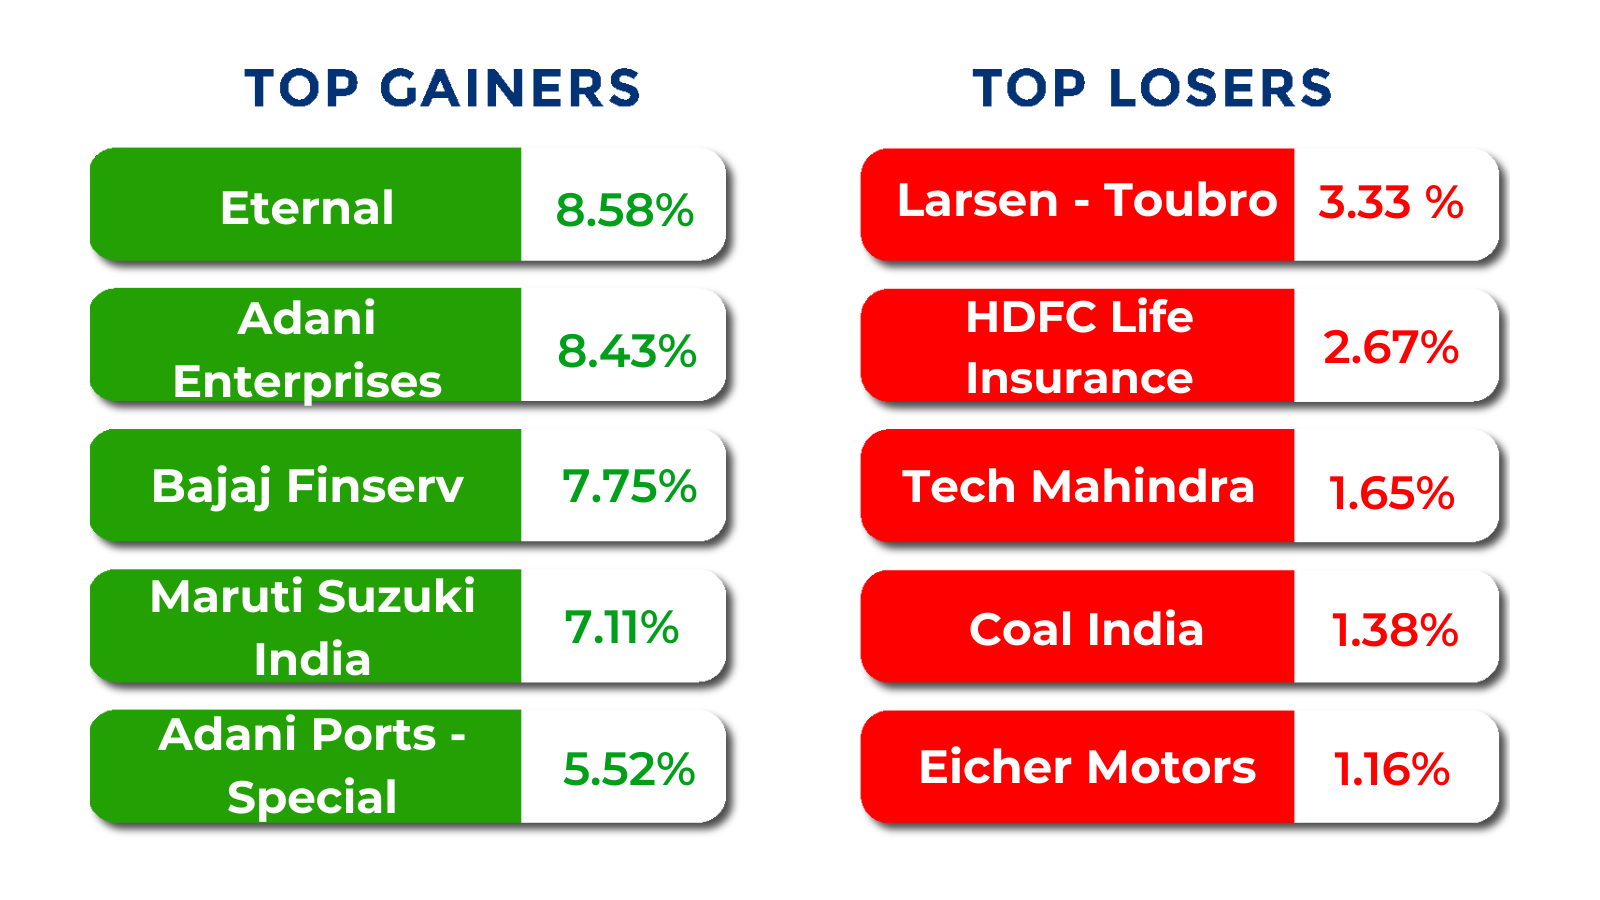
Top Gainers and Losers
Currency Chronicles
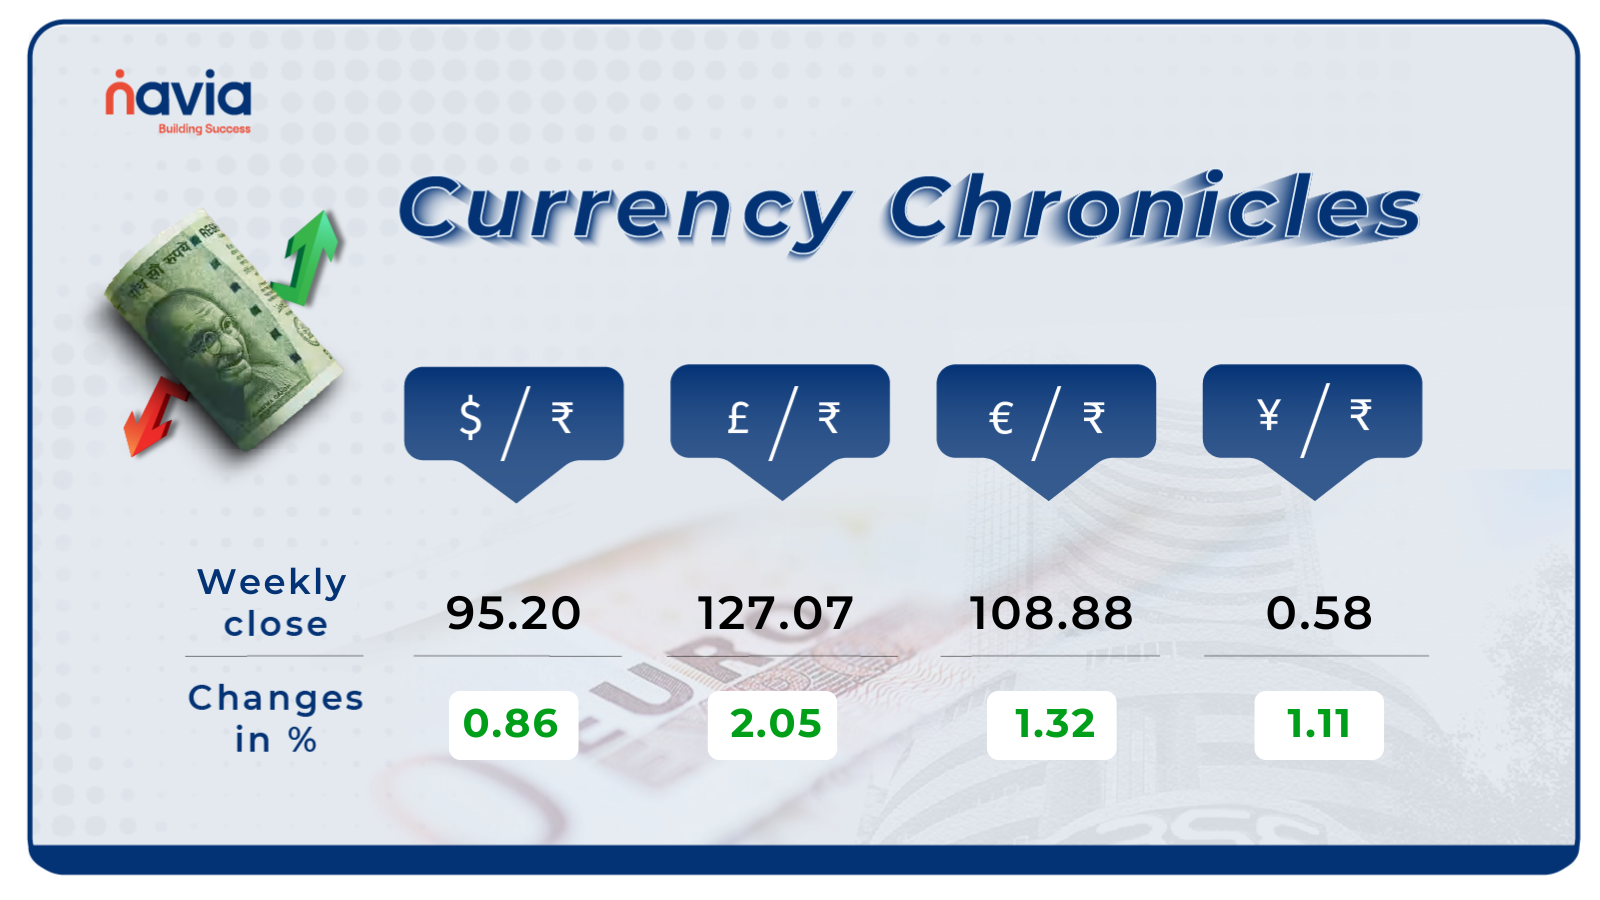
USD/INR:
The USD/INR rate closed at ₹95.20 per dollar, up 0.86% for the week, reflecting bullish market sentiment.
EUR/INR:
The EUR/INR rate closed at ₹108.88 per euro, up 1.32% for the week, reflecting bullish market sentiment.
JPY/INR:
The JPY/INR rate closed at ₹0.58 per yen, up 1.11% for the week, reflecting bullish market sentiment.
Stay tuned for more currency insights next week!
Commodity Corner
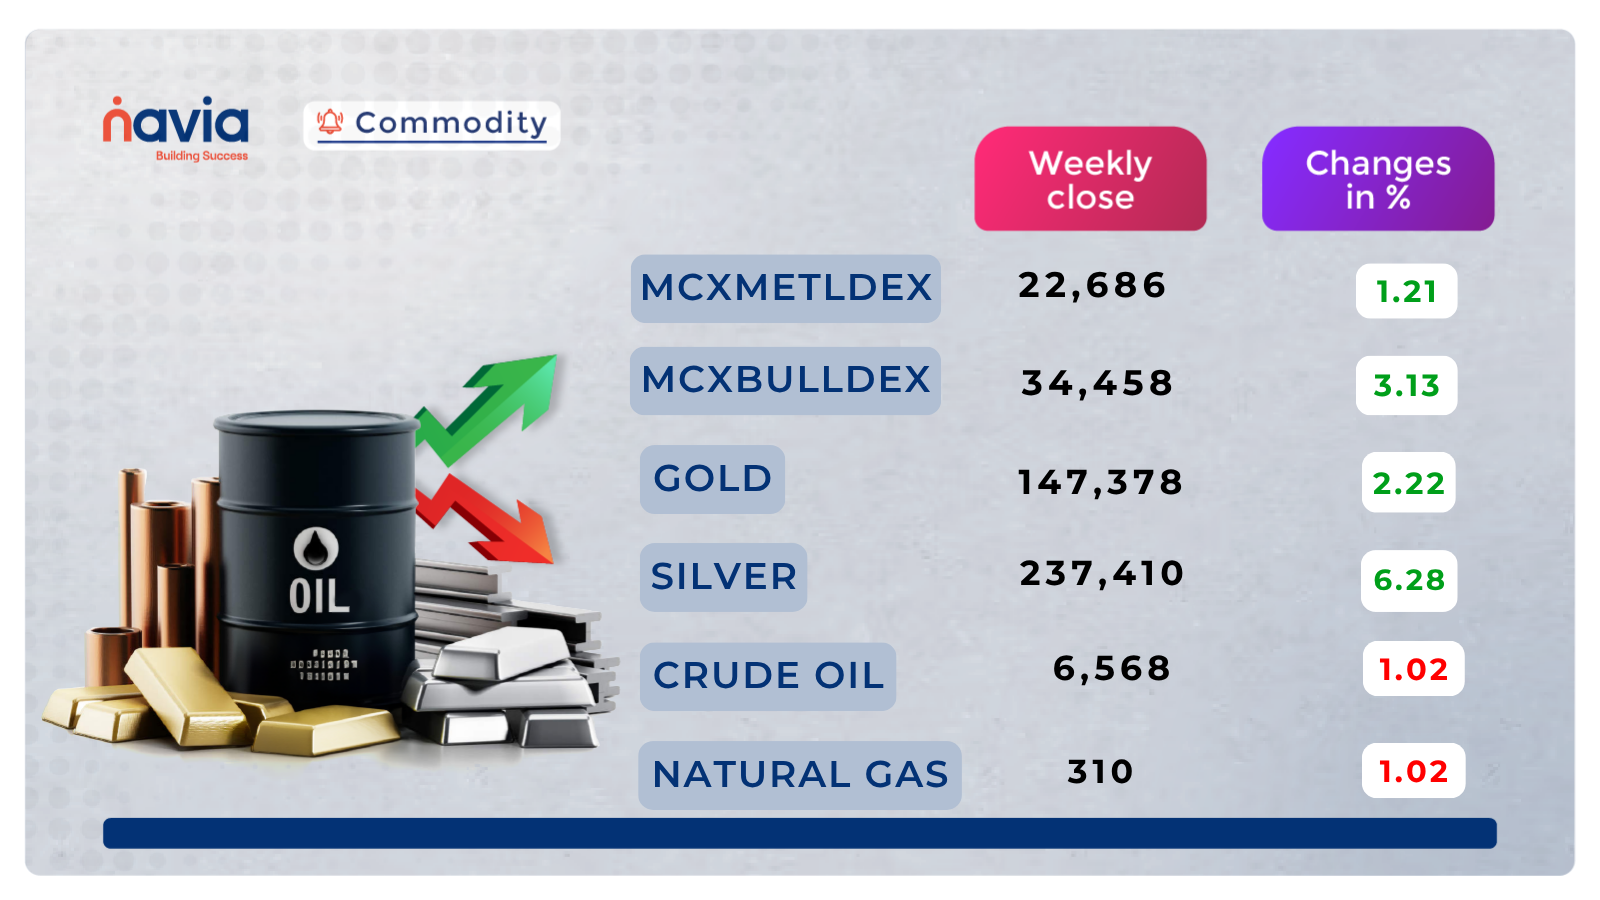
Crude Oil futures are showing a marginal positive candle as price attempts to stabilise following the sustained multi-week corrective decline that has brought price from the 8,400–8,800 highs to the current 6,435–6,740 demand zone. The prior sessions reflect a deepening bearish phase with new multi-month lows being established without meaningful buyer intervention, and the current small green candle represents tentative early consolidation rather than a confirmed base formation.
Price is currently trading between the R2 resistance at 6,739–6,740 above and the S1 support at 6,435 below, reflecting a compressed consolidation range. The 6,740 level now acts as the key near-term resistance trigger, and a decisive close above it would signal stabilisation and invite buying toward 6,785 and 6,830. Until that reclaim is confirmed on a closing basis, the dominant bearish structure from the June highs continues to favour sellers on any intraday bounce toward resistance.
On the downside, a sustained close below 6,435 would confirm the next leg of bearish decline and expose 6,390 and 6,345, extending the corrective move into fresh multi-month lows. Sellers retain the structural advantage as long as price holds below 6,740 on a closing basis.
Gold futures are currently showing a small red candle with mild negative pressure as price consolidates within the 143,897–146,531 range between the key red resistance and support lines. The descending trendline from the mid-May highs near 162,000 continues to press price lower on each recovery attempt, and the current session reflects the ongoing absence of sustained buyer conviction at current multi-month low levels following the extended corrective decline.
Price is currently trapped between the R2 resistance band at 146,500 above and the S1 support at 144,000 below, reflecting a compressed near-term structure. A decisive close above 146,500 would signal the beginning of a meaningful recovery and open the path toward 148,000 and 150,000, beginning to challenge the descending trendline overhead. Until that level is reclaimed convincingly on a closing basis, the dominant bearish structure from the May highs continues to keep sellers in structural control.
On the downside, a sustained close below 144,000 would confirm renewed bearish momentum and open the path toward 142,500 and 141,000, re-approaching and potentially extending beyond the prior multi-month lows. The descending trendline remains the dominant structural feature, and sellers retain the near-term advantage as long as price holds below 146,500 on a closing basis.
Natural Gas futures are showing a small red candle with mild negative pressure as price consolidates just above the ascending trendline from mid-June following the recent pullback from the 319 highs. The broader price structure has been characterised by a series of oscillations between the 289–324 range over recent weeks, and the ascending trendline continues to provide structural support beneath current price, keeping the medium-term recovery framework intact despite the near-term softness.
The price action near the 305–310 zone reflects indecision between buyers and sellers, with the ascending trendline now approaching the current price from below and compressing the structure toward a potential directional resolution. A decisive close above 314 would confirm renewed bullish momentum and open the path toward 316 and 318. The broader ascending trendline from late May continues to preserve the structural case for buyers as long as 305 holds on a closing basis.
On the downside, a sustained close below 305 would confirm a breakdown from the ascending trendline and invite corrective pressure toward 303 and 301, with the broader 288–290 medium-term demand base acting as the significant structural reference in that scenario.
Silver Futures are showing a small red candle with mild negative momentum as price continues to oscillate within the 225,000–236,000 range that has persisted since the sharp corrective decline from the May highs near 300,000. The descending trendline from the May peak continues to cap recovery attempts, and the current session reflects continued indecision near the lower end of the recent consolidation range without a clear directional resolution having emerged.
Price is currently trading between the key red resistance band at 233,184–236,000 above and the S1 support at 228,000 below. A decisive close above 236,000 would signal a meaningful shift in near-term momentum and open the path toward 238,500 and 241,000, beginning a genuine retracement of the sharp June decline. Until that level is reclaimed convincingly on a closing basis, the descending trendline and the pattern of lower highs continue to keep sellers in a position of structural advantage.
On the downside, a sustained close below 228,000 would confirm renewed bearish pressure and open the path toward 225,500 and 223,000, re-approaching the prior multi-month lows established during the June corrective phase.
Do you have a question? Ask here and we’ll publish the information in the coming weeks.
Top Blogs of the Week!

ASM in Share Market: Meaning, Purpose and What Investors Should Know
When an Indian stock suddenly receives the ASM (Additional Surveillance Measure) tag, retail investors often panic-sell, assuming the company is facing financial ruin or regulatory penalties. In reality, ASM is a joint preemptive warning shield designed by SEBI and the stock exchanges (NSE and BSE) to control extreme speculation, protect retail capital, and preserve market integrity.

Fresh Issue vs OFS: Key Differences Every IPO Investor Should Know
This blog post serves as an essential structural primer for Indian retail investors evaluating Initial Public Offerings (IPOs) on the NSE and BSE. It demystifies capital allocation structures, shifting focus from speculative market hype to balance sheet fundamentals.
N Coins Rewards

Refer your Friends & Family and GET 500 N Coins.
Do You Find This Interesting?

DISCLAIMER: Investment in securities market are subject to market risks, read all the related documents carefully before investing. The securities quoted are exemplary and are not recommendatory. Full disclaimer: https://bit.ly/naviadisclaimer.