Mastering Moving Averages: A Beginner’s Guide

Introduction
Moving averages are one of the simplest yet most powerful tools in technical analysis . They help traders and investors identify trends, determine support and resistance levels, and generate trading signals. In this article, we’ll explain moving averages in a beginner-friendly manner, provide examples, and suggest the most common settings for new traders and investors.
What is a Moving Average?
A moving average (MA) is a line on a price chart that smooths out price data over a specific period. It helps you see the overall direction of a stock or asset by filtering out short-term fluctuations.
Types of Moving Averages:
1. Simple Moving Average (SMA): The average price over a specific number of periods.
2. Exponential Moving Average (EMA): Gives more weight to recent prices, making it more responsive to price changes.
How to Use Moving Averages
1. Identify Trends
Moving averages help determine the overall market direction:
● Uptrend: Price stays above the moving average.
● Downtrend: Price stays below the moving average.
Example:
If a stock’s 50-day SMA is sloping upward and the price stays above it, the stock is likely in an uptrend.
2. Crossovers for Buy/Sell Signals
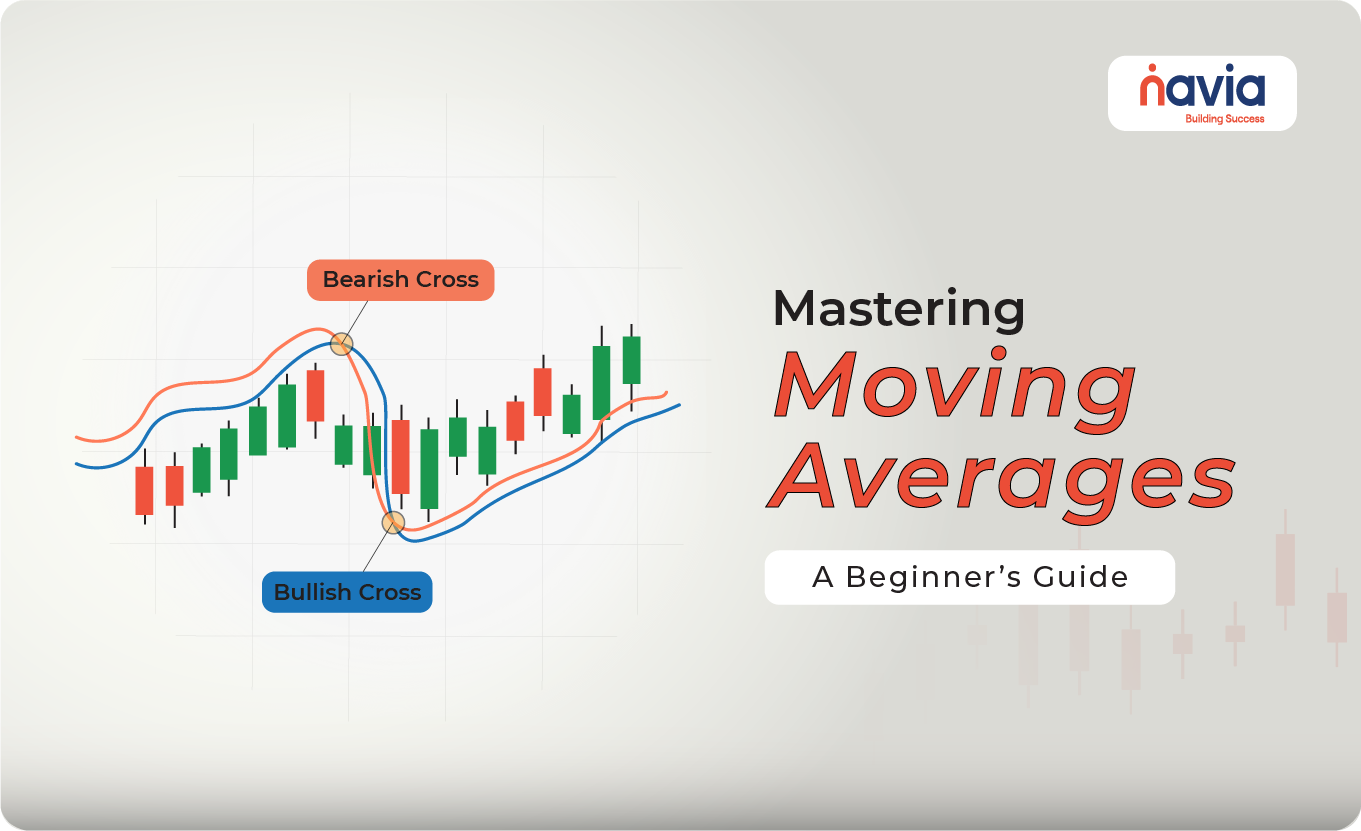
A crossover occurs when two moving averages intersect. The most common are:
● Golden Cross (Bullish Signal): A short-term MA (e.g., 50-day) crosses above a long-term MA (e.g., 200-day).
● Death Cross (Bearish Signal): A short-term MA crosses below a long-term MA.
Example:
If the 50-day SMA crosses above the 200-day SMA, it indicates a potential buy opportunity (Golden Cross). Conversely, if the 50-day SMA crosses below the 200-day SMA, it signals a sell opportunity (Death Cross).
3. Dynamic Support and Resistance
Moving averages often act as dynamic support or resistance levels where the price tends to bounce off.
Example:
If the price approaches the 100-day EMA in an uptrend, it may bounce back upward, indicating the EMA is acting as support.
Examples in Tabular Format
| Scenario | Price Action | Moving Average Signal | Trading Insight |
| Uptrend | Price stays above the 50-day SMA. | Bullish | Consider staying in a long position. |
| Downtrend | Price stays below the 200-day SMA. | Bearish | Consider avoiding new long positions. |
| Golden Cross | 50-day SMA crosses above the 200-day SMA. | Bullish crossover | Potential buy signal. |
| Death Cross | 50-day SMA crosses below the 200-day SMA. | Bearish crossover | Potential sell signal. |
| Dynamic Support | Price bounces off the 100-day EMA in an uptrend. | Support confirmed | Consider buying near the EMA. |
| Dynamic Resistance | Price rejects the 50-day SMA in a downtrend. | Resistance confirmed | Consider selling near the SMA. |

Common Settings for Moving Averages
1. Short-Term MAs (for fast signals):
🠖 5-day or 10-day: Used for intraday or swing trading.
🠖 Best for identifying short-term trends and quick reversals.
2. Medium-Term MAs (for broader trends):
🠖 20-day, 50-day, or 100-day: Used for swing trading or position trading.
🠖 Helps confirm the continuation or reversal of trends.
3. Long-Term MAs (for major trends):
🠖 200-day: Widely used by long-term investors.
🠖 Acts as a strong indicator of the overall market trend.
Summary of Moving Average Settings
| Purpose | Timeframe | Common Settings |
| Short-Term Trends | 1-2 weeks | 5-day, 10-day |
| Medium-Term Trends | 1-3 months | 20-day, 50-day |
| Long-Term Trends | 6 months or more | 100-day, 200-day |
Best Practices for Using Moving Averages
1. Combine with Other Indicators: Use moving averages alongside RSI, MACD, or Bollinger Bands for confirmation.
2. Adjust for Your Style: Shorter MAs are better for active traders, while longer MAs suit investors.
3. Avoid Using Alone: Moving averages lag behind price action. Always use them with other analysis tools to avoid false signals.
Conclusion
Moving averages are a versatile tool that can simplify your trading decisions by helping you identify trends and generate signals. Whether you’re a short-term trader or a long-term investor, mastering moving averages is a fundamental step in your journey.
Start by experimenting with the 50-day SMA and 200-day SMA for medium- and long-term trends, and gradually explore other settings to suit your trading style.
Happy Trading!
Do You Find This Interesting?
DISCLAIMER: Investments in the securities market are subject to market risks, read all the related documents carefully before investing. The securities quoted are exemplary and are not recommendatory. Brokerage will not exceed the SEBI prescribed limit.


