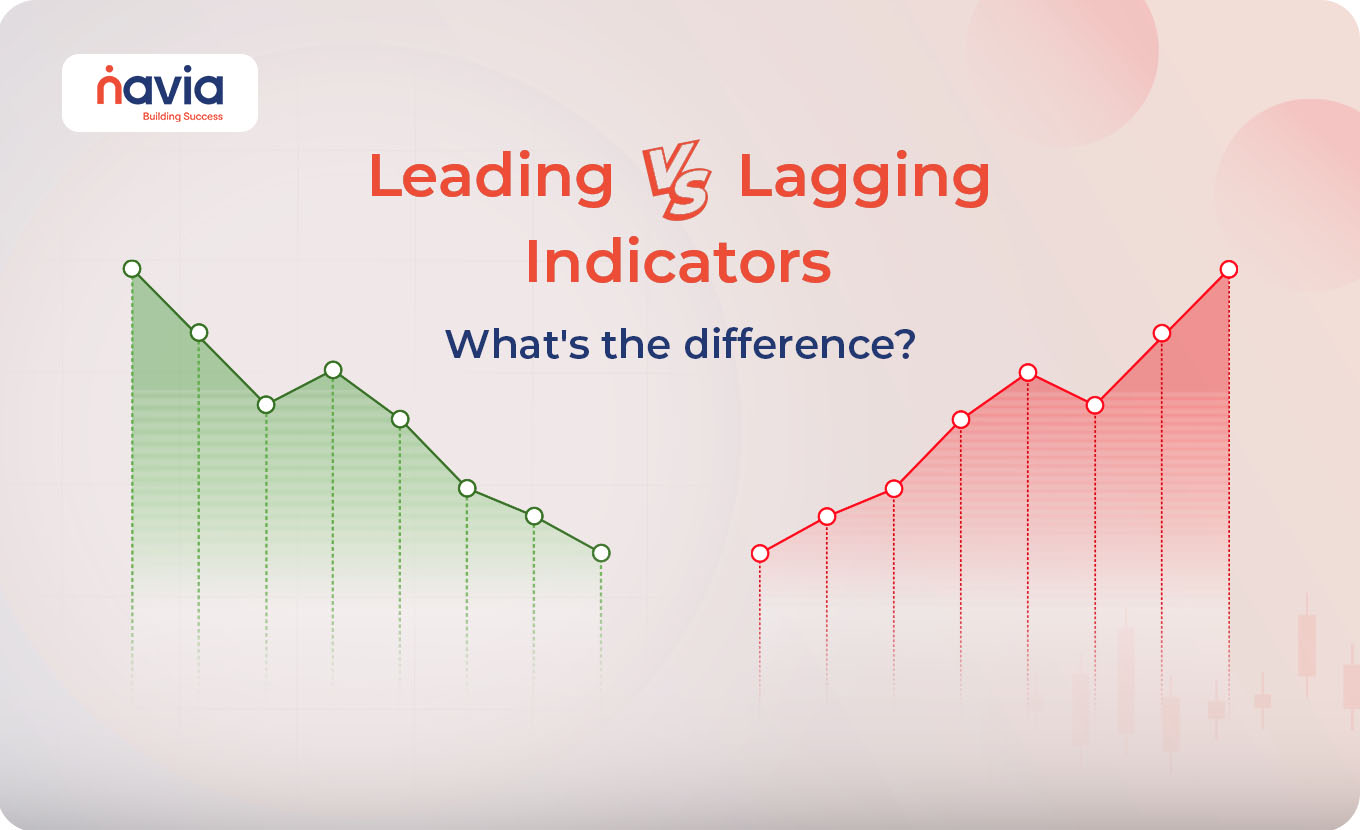
Leading Vs Lagging Indicators Explained: What’s the Difference?
We know that in the journey of investing and trading timing is an integral part, whether you are analyzing stocks or commodities, understanding when to enter or exit a trade will impact your success. That’s where leading and lagging indicators get the attention. These tools will help both traders and investors to predict market trends, but they serve very different purposes.
In this blog, we will explain about the difference between leading and lagging indicators, explore its examples and decide when to use them in your investment strategy.
What Are Leading Indicators?
Leading indicators are tools that will aim to predict future price movements. They will offer signals before a new trend or reversal happens and give traders an early warning. And these indicators are mainly used by active traders they are looking to anticipate market moves on time.
Let’s see some examples of leading indicators;
| Leading Indicators | Definition |
|---|---|
| Relative Strength Index (RSI) | Measures the speed and change of price movements |
| Stochastic Oscillator | Identify potential reversal points by comparing a security’s closing price to its price range over time |
| MACD Histogram | MACD itself is a lagging indicator, the histogram (the difference between MACD and the signal line) can act as a leading signal |
| Volume | Rising volume often precedes a breakout or breakdown in price |
| Fibonacci Retracement Levels | Used to identify possible support and resistance levels before the price reacts |
What Are Lagging Indicators?
Lagging Indicators provide signals after a trend has started. We can call it confirmation tools, that are useful for validating that a trend is real and not just a temporary fluctuation. Mostly these tools are used by long-term investors or swing traders who prefer to confirm a trend before action.
Let’s see some examples of lagging indicators;
| Lagging Indicators | Definition |
|---|---|
| Moving Averages | Help smooth out price action and highlight long-term trends |
| MACD (Moving Average Convergence Divergence) | Tracks the relationship between two moving averages to identify trend direction and strength |
| Bollinger Bands | Show volatility and price movement based on a moving average but react after price changes |
| Average Directional Index (ADX) | Measures the strength of a trend, not its direction, and tends to lag price movement |
Key Differences Between Leading and Lagging Indicators
Here we can analyze what are the features that will differentiate leading vs lagging indicators.
| Features | Leading Indicators | Lagging Indicators |
|---|---|---|
| Timing | Predict future trends | Confirm existing trends |
| Usage | Early entry or exit | Safe confirmation |
| Best for | Day traders, short-term trades | Long-term investors |
| Risk Level | Higher | Lower |
| Examples | RSI, stochastic | MACD, moving average |

When to Use Leading Indicators?
Leading indicators are most useful in the following situations;
🠖 Anticipating Trend Reversals: Tools like RSI and Stochastic Oscillator spot early signs of trend reversals.
🠖 Breakout Trading: Volume surges and chart patterns like flags can act as early breakout signals.
🠖 Range-Bound Markets: The indicator can work well when the price is bouncing between support and resistance levels.
Remember that leading indicators are predictive because they are also prone to false signals especially in choppy or sideways markets.
When to Use Lagging Indicators?
Lagging indicators are best to use when;
🠖 You Want Confirmation: Before starting trade, confirming a trend by using moving averages or MACD can prevent premature decisions.
🠖 Following Established Trends: It is an ideal indicator for momentum or trend-following strategies.
🠖 Minimizing Risk: Escape your investments from fake breakouts or false signals.
If you do not get in at the exact bottom or top, lagging indicators can help you stay in a trend longer and avoid market noise.
Conclusion
Understanding the difference between leading and lagging indicators can elevate your trading strategy and decision-making process. Leading indicators help you anticipate potential moves and lagging indicators provide the confirmation needed to trade with confidence. If you use it together, you can get a balanced and informed view of the markets.
The choice completely depends on your trading style, time horizon and risk appetite. Traders can use a mix of leading and lagging indicators depending on their strategy and risk appetite.
Do You Find This Interesting?
We’d Love to Hear from you-

Frequently Asked Questions
What is the difference between leading and lagging indicators?
Leading indicators are metrics that predict future trends or changes in performance. They give early signals before a trend occurs, helping traders and analysts anticipate outcomes. Lagging indicators, on the other hand, reflect past performance, confirming trends only after they’ve occurred. While leading indicators help in forecasting, lagging indicators are better for validating decisions.
What is an example of a lag and lead indicator?
A leading indicator example in trading is the Relative Strength Index (RSI), which shows when an asset might be overbought or oversold before a price change.
A lagging indicator example is the moving average, which confirms a trend only after the price has moved significantly.
How to tell if a signal is leading or lagging?
To identify whether a signal is leading or lagging, observe when the signal occurs in relation to the event or trend. If the signal appears before the actual movement, it’s a leading indicator. If the signal follows the movement, confirming what has already happened, it’s a lagging indicator. Leading indicators often involve predictions, while lagging ones offer confirmation.
Why is it called the “lagging” strand?
Because it follows or “lags behind” actual market or economic events. These indicators only reflect changes after a trend has already occurred. Traders and analysts use lagging indicators to confirm trends rather than predict them.
Which is better: leading or lagging indicators?
It depends on your investment strategy. Leading indicators are often used by short-term traders to anticipate moves, while lagging indicators are more commonly used by long-term investors to confirm trends.
Can I use both combining and lagging indicators together?
Yes! Combining leading and lagging indicators often results in more accurate trading signals and improved risk management.
DISCLAIMER: Investments in securities market are subject to market risks, read all the related documents carefully before investing. The securities quoted are exemplary and are not recommendatory. Full disclaimer: https://bit.ly/naviadisclaimer.