Large Cap, Mid Cap, or Small Cap SIP – Which is Better for Long-Term Investing?
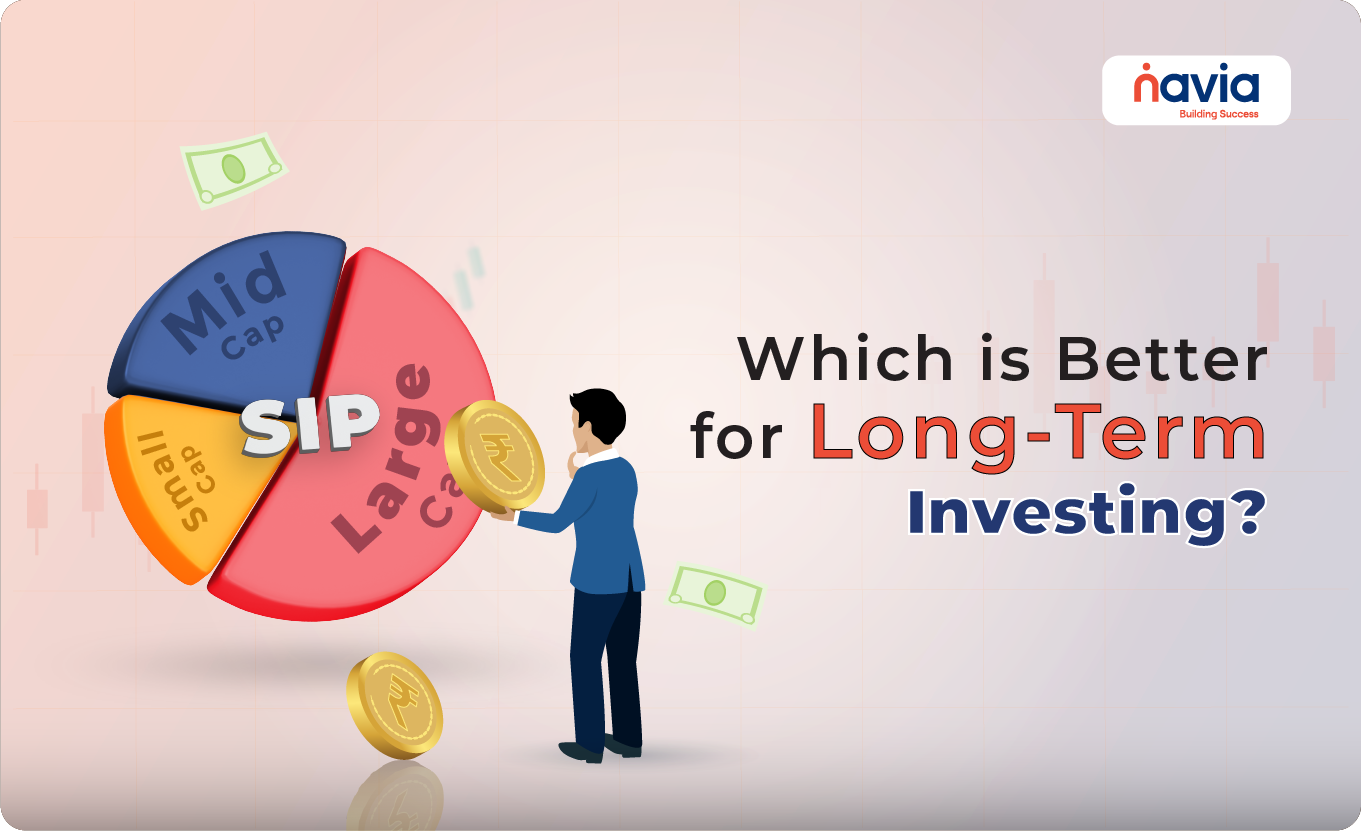
Investors often wonder which market cap category is best when setting up a Systematic Investment Plan (SIP) – Large Cap, Mid Cap, or Small Cap. Let’s break down these segments using data from the WhiteOak Capital Mutual Fund study on SIP returns.
💡 Quick Answer
Over 10-year monthly rolling periods from April 2005 to May 2024, Mid Cap SIPs averaged 16.9%, Small Cap 14.1% and Large Cap 12.7%. Large Cap and Mid Cap delivered a positive return 100% of the time and Small Cap 99%. Mid Cap led on both average and maximum returns.
Key Characteristics of Market Cap Categories:
Large Cap Funds:
- Invest in established, stable companies.
- Offer relatively lower risk and stable returns.
Mid Cap Funds:
- Invest in mid-sized companies with growth potential.
- Offer a balance of risk and return.
Small Cap Funds:
- Invest in smaller, emerging companies.
- Offer higher growth potential but come with significant risk and volatility.
Successful SIP: The Smart Investor’s Choice!
A successful SIP is more about “Starting Early”, maintaining the discipline of “Investing Regularly”, investing for the “Long Term” to achieve our “Financial Goals” and less about “Which Date”, “Which Frequency”, “At what stage of the Market Cycle” etc.

Historical SIP Performance (April 2005 – May 2024)
| Metric | Nifty 100 TRI (Large Cap) | Nifty Midcap 150 TRI (Mid Cap) | Nifty Smallcap 250 TRI (Small Cap) |
|---|---|---|---|
| Minimum Return | 4.3% | 6.0% | -0.4% |
| Maximum Return | 16.3% | 21.7% | 20.4% |
| Average Return | 12.7% | 16.9% | 14.1% |
| Median Return | 12.8% | 17.1% | 14.6% |
| % Times Positive Return | 100% | 100% | 99% |
| % Times > 10% Return | 92% | 97% | 85% |
| % Times > 12% Return | 68% | 95% | 76% |
| % Times > 15% Return | 9% | 76% | 48% |
10 Year Monthly Rolling (% XIRR) Return considered from April 2005 to May 2024, first observation recorded on 1-Apr-15.
What the Rolling Return Data Shows
Lower Volatility, Steady Returns:
- Large Cap funds delivered consistent positive returns with lower volatility.
- Investors prioritizing stability may prefer this category.
High Growth Potential:
- Mid Cap funds outperformed others in terms of average and maximum returns, making them suitable for investors seeking balanced risk and returns.
High Risk-High Reward:
- Small Cap funds demonstrated the potential for higher returns but also came with higher risk and occasional negative returns.

Final Recommendation:
- For conservative investors focused on capital preservation, Large Cap funds offer stability.
- For moderate to high risk investors looking for growth, Mid Cap funds are an excellent choice due to their consistent historical performance.
While each market cap segment has its pros and cons, historical data suggests that a diversified SIP portfolio spread across these segments can maximize returns while mitigating risks. As always, consult with a financial advisor before making investment decisions.
Key Takeaways
- Large Cap funds invest in established, stable companies and offer relatively lower risk and stable returns.
- Mid Cap funds outperformed others in terms of average and maximum returns, averaging 16.9% against 12.7% for Large Cap.
- Small Cap funds returned a positive result 99% of the time, with a minimum of -0.4%, the only negative minimum of the three.
- Large Cap and Mid Cap SIPs delivered a positive return 100% of the time over the period studied.
- Historical data suggests a diversified SIP portfolio spread across these segments can maximize returns while mitigating risks.
- Figures are 10 Year Monthly Rolling XIRR returns from April 2005 to May 2024, first observation recorded on 1-Apr-15.
DID YOU FIND THIS INTERESTING?
We’d love to hear from you –

Frequently Asked Questions
Which market cap gave the highest average SIP return?
Mid Cap. Over 10 Year Monthly Rolling periods from April 2005 to May 2024, Nifty Midcap 150 TRI averaged 16.9%, against 14.1% for Nifty Smallcap 250 TRI and 12.7% for Nifty 100 TRI.
Did any category ever deliver a negative 10-year SIP return?
Small Cap did. Nifty Smallcap 250 TRI shows a minimum return of -0.4% and was positive 99% of the time, while Large Cap and Mid Cap were positive 100% of the time.
Are Small Cap SIPs riskier than Large Cap SIPs?
Yes. Small Cap funds invest in smaller, emerging companies and offer higher growth potential but come with significant risk and volatility, while Large Cap funds offer relatively lower risk and stable returns.
How often did Mid Cap SIPs beat 15% returns?
76% of the time, against 48% for Small Cap and 9% for Large Cap.
Should I pick just one market cap category for my SIP?
Historical data suggests that a diversified SIP portfolio spread across these segments can maximize returns while mitigating risks. The article also advises consulting a financial advisor before making investment decisions.
What matters most for a successful SIP?
A successful SIP is more about starting early, maintaining the discipline of investing regularly and investing for the long term, and less about which date, which frequency, or the stage of the market cycle.
Do You Find This Interesting?
DISCLAIMER: Investments in the securities market are subject to market risks, read all the related documents carefully before investing. The securities quoted are exemplary and are not recommendatory. Brokerage will not exceed the SEBI prescribed limit. Full disclaimer: https://bit.ly/naviadisclaimer