Understanding the Double Bottom Pattern in Technical Analysis
The Double Bottom Pattern is a bullish reversal pattern commonly used in technical analysis. It indicates a potential change in market direction from a downtrend to an uptrend. The pattern gets its name from the two consecutive price lows that appear at roughly the same level, forming a “W” shape on the chart. The Double Bottom Pattern signals that selling pressure is weakening, and buyers may take control, leading to an upward move.
In this article, we will explore how to identify the Double Bottom Pattern, discuss its significance, explain target prices and stop-loss strategies, and provide step-by-step examples for better understanding.
What is the Double Bottom Pattern?
The Double Bottom Pattern forms after a sustained downtrend and is characterized by two nearly equal lows, followed by a breakout above a key resistance level. The pattern represents a battle between buyers and sellers, where the price makes two unsuccessful attempts to break lower, signaling a shift in momentum toward the bulls.
The neckline, or resistance level, is drawn across the intermediate high between the two bottoms. Once the price breaks above the neckline, the pattern is confirmed, and the market is expected to reverse its direction to the upside.
Key Characteristics of the Double Bottom Pattern
Two Equal Lows
The price forms two consecutive lows at roughly the same level, indicating strong support and a potential reversal. The price fails to break lower on the second attempt, signaling that the selling pressure is weakening.
Neckline
The neckline is the resistance level that connects the intermediate peak between the two lows. A breakout above the neckline confirms the pattern and signals a bullish reversal.
“W” Shape
The pattern forms a distinctive “W” shape on the chart, where the two bottoms represent the lows and the middle section is the intermediate high (neckline).
Volume
Volume often decreases during the formation of the pattern and spikes during the breakout above the neckline, confirming the reversal.
How to Identify the Double Bottom Pattern
Identify Two Lows:
Look for two consecutive lows at roughly the same price level. These lows should be spaced apart by a significant amount of time, ideally weeks or months.
Spot the Neckline:
Draw the neckline by connecting the intermediate high that forms between the two lows. This horizontal or slightly downward-sloping line acts as resistance.
Wait for the Breakout:
The pattern is confirmed when the price breaks above the neckline with strong volume, signaling a bullish reversal.
Measure the Target:
Measure the distance between the neckline and the lowest point of the bottoms, and project that distance upward from the neckline to set a target price.
Trading the Double Bottom Pattern
Entry Point
Enter a long position when the price breaks above the neckline with significant volume, confirming the reversal.
Stop-Loss
Place your stop-loss just below the second bottom to protect against a potential false breakout.
Target Price
The target price is calculated by measuring the height of the pattern (the distance between the neckline and the bottoms) and projecting that distance upward from the breakout point.
Numerical Example of a Double Bottom Pattern
Let’s break down a simple example of a Double Bottom Pattern using numbers.
| Action | Price (₹) | Description |
|---|---|---|
| First Bottom | 100 | Price declines to ₹100, forming the first bottom |
| Intermediate High | 120 | Price rises to ₹120, forming the neckline resistance |
| Second Bottom | 100 | Price declines again to ₹100 but fails to break lower |
| Breakout | 120+ | Price breaks above ₹120 with strong volume |
| Target Price | 140 | Target = ₹120 + (₹120 – ₹100) = ₹140 |
| Stop-Loss | 95 | Stop-loss placed just below the second bottom at ₹95 |
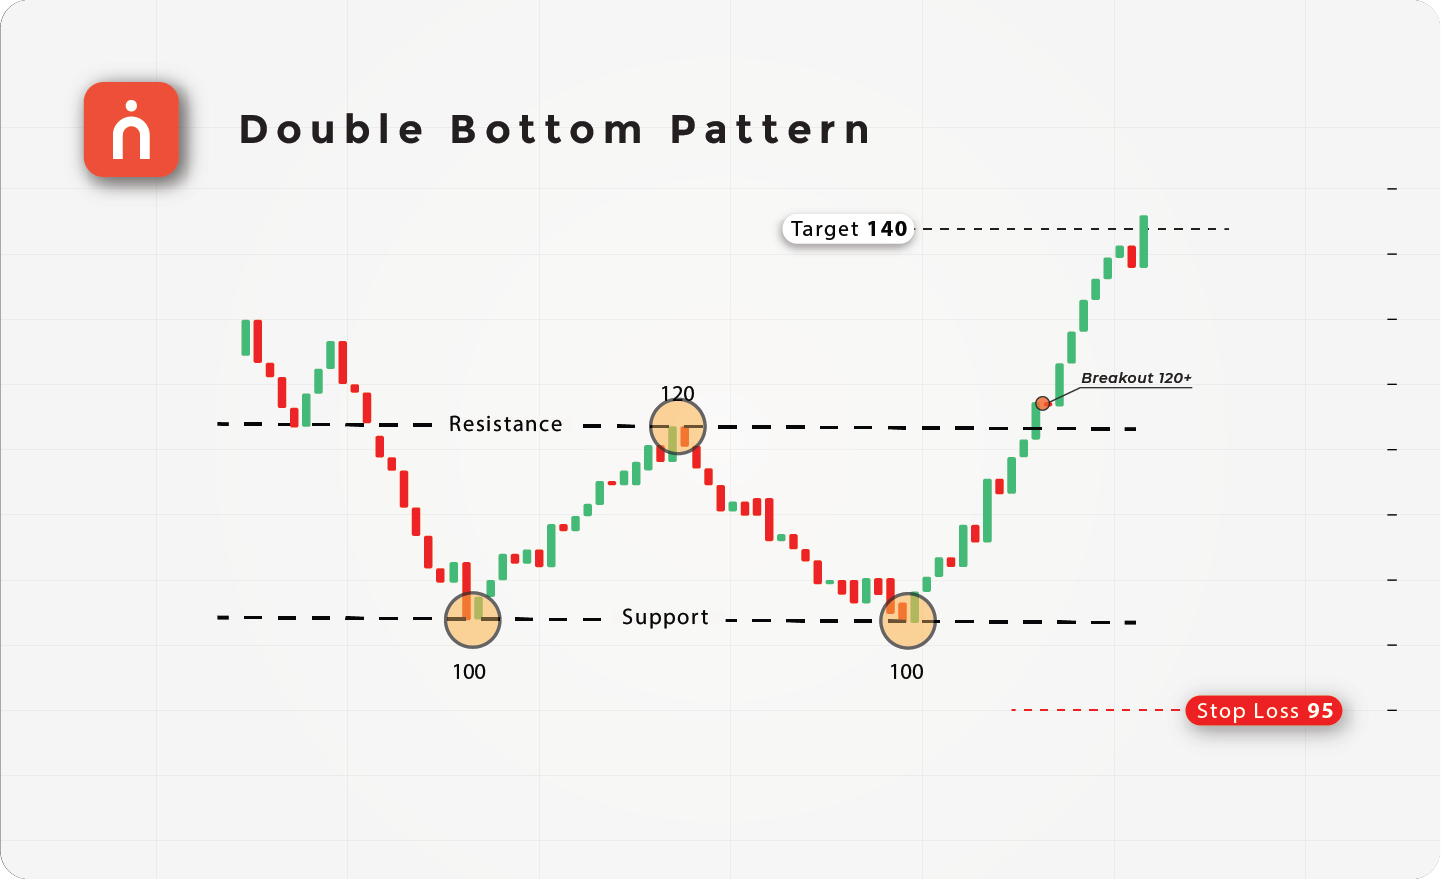
In this example, the price forms the first bottom at ₹100, rises to ₹120, and then declines again to ₹100, forming the second bottom. The price breaks above the neckline at ₹120, signaling a bullish reversal, and the target is set at ₹140 by measuring the height of the pattern (₹120 – ₹100 = ₹20) and adding it to the breakout point. The stop-loss is placed just below ₹100 at ₹95.
Significance of Volume in the Double Bottom Pattern
Volume is crucial in confirming the validity of the Double Bottom Pattern:
➝ Volume During the Pattern:
Volume typically decreases during the formation of the two bottoms, reflecting weakening selling pressure and consolidation.
➝ Volume Spike at Breakout:
When the price breaks above the neckline, a volume spike confirms the breakout. This increase in volume shows that buying interest is strong, and the trend reversal is more likely to succeed.
➝ Avoiding False Breakouts:
A breakout without a significant volume increase may signal a false breakout. Traders should wait for a volume spike to confirm the strength of the reversal.
Example of a Double Bottom Pattern with Volume Spike
Here’s a detailed example of a Double Bottom Pattern with volume:
| Action | Price (₹) | Volume | Description |
|---|---|---|---|
| First Bottom | 200 | 1,00,000 | Price declines to ₹200, forming the first bottom |
| Intermediate High | 240 | 80,000 | Price rises to ₹240, forming the neckline resistance |
| Second Bottom | 200 | 70,000 | Price declines again to ₹200, forming the second bottom |
| Breakout | 240+ | 1,50,000 | Price breaks above ₹240 with a volume spike |
| Target Price | 280 | Target = ₹240 + (₹240 – ₹200) = ₹280 | |
| Stop-Loss | 195 | Stop-loss placed just below the second bottom at ₹195 |
In this example, the price forms two consecutive bottoms at ₹200 and fails to break lower. The neckline is drawn at ₹240, and the price breaks above this level with a volume spike (from 80,000 shares to 1,50,000 shares), confirming the bullish reversal. The target price is set at ₹280, and the stop-loss is placed just below ₹200.
When Does the Double Bottom Pattern Occur?
The Double Bottom Pattern forms after a sustained downtrend and signals a potential reversal in market direction. It indicates that selling pressure has exhausted, and buyers are beginning to step in, pushing the price higher. The pattern is more reliable when it forms over a longer time frame (weeks or months) and is most effective when accompanied by increasing volume during the breakout.
Trading Strategies for Double Bottom Patterns
➝ In Bullish Markets:
The Double Bottom Pattern is a reversal signal, and traders can look for buying opportunities when the price breaks above the neckline resistance level.
➝ Volume-Based Confirmation:
A volume spike during the breakout confirms the strength of the bullish reversal. If the breakout occurs on low volume, traders should be cautious as it may indicate a false breakout.
➝ Target and Stop-Loss Setting:
Use the height of the pattern to set a realistic target price, and place your stop-loss just below the second bottom to manage risk.

Conclusion
The Double Bottom Pattern is a reliable and easy-to-identify bullish reversal pattern that signals a potential change in market direction from a downtrend to an uptrend. By identifying the two consecutive lows, spotting the neckline, and waiting for a volume-confirmed breakout, traders can effectively capture the potential gains from the reversal.
With clear entry points, stop-loss levels, and target prices, the Double Bottom Pattern offers a structured and low-risk approach to trading market reversals, helping traders capitalize on the shift in market sentiment.
Do You Find This Interesting?
We’d Love to Hear from you-

DISCLAIMER: Investments in the securities market are subject to market risks, read all the related documents carefully before investing. The securities quoted are exemplary and are not recommendatory. Brokerage will not exceed the SEBI prescribed limit.