Dark Clouds on the Horizon: Understanding the Bearish Dark Cloud Cover Pattern
- What is the Dark Cloud Cover Pattern?
- The Market Story Behind the Dark Cloud Cover Candle Pattern
- Where to Spot a High-Probability Dark Cloud Cover Pattern?
- How to Execute Your Dark Cloud Cover Entry?
- Conclusion
- Frequently Asked Questions
In financial trading, discerning shifts in market sentiment is crucial for successful decision-making. It is possible to turn ominous on a clear sunny day with the arrival of dark clouds; an upward trending market can signal reversal with the appearance of the dark cloud cover pattern.
This powerful two-candle formation whispers traders that the “bulls” are losing their grip, and the “bears” are preparing to take control. Like the sudden shift in the weather, you can see the changes in the market too.
This blog will help you understand the dark cloud cover candle pattern, explaining what it is, the market story, and how you can use it to make smarter trading decisions.
What is the Dark Cloud Cover Pattern?
So, actually what is a dark cloud cover pattern? It’s a simple two-candlestick bearish reversal pattern that typically appears at the top of an uptrend. It is considered a strong warning sign that the current upward current upward move might be ending, and a downward trend is about to begin.
Its unique formation makes it easy to spot for the traders;
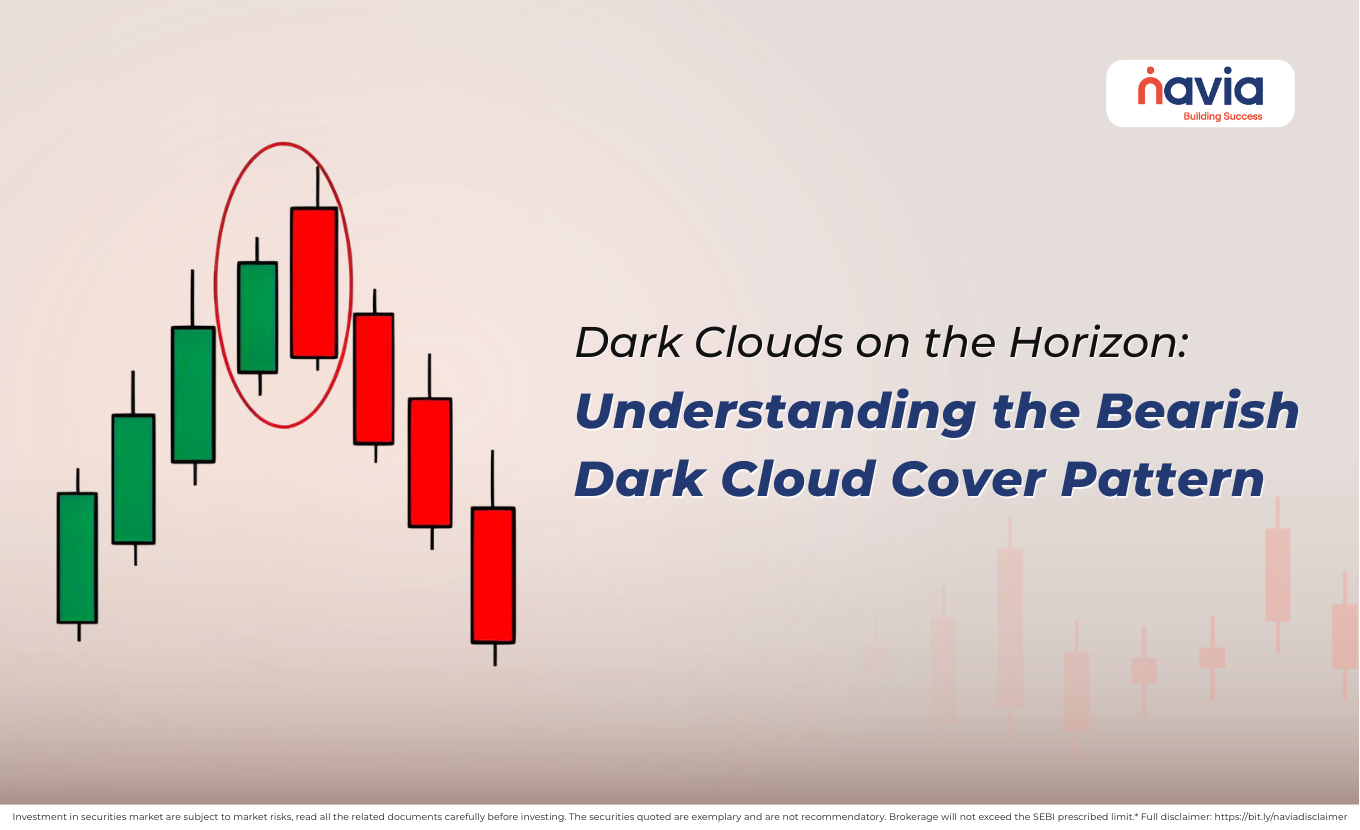
| The First Candle (The Sunny Day) | This is a strong, bullish (usually green or white) candle. It confirms that the current uptrend is still in full force, and buyers are confidently pushing prices higher. |
| The Second Candle (The Dark Cloud) | This crucial bearish (usually red or black) candle that “covers” the previous bullish candle. It opens above the high of the first candle (a gap up), but then sellers immediately take control. The price is pushed significantly lower, closing well within the body of the first bullish candle, ideally below its midpoint. |
The Market Story Behind the Dark Cloud Cover Candle Pattern
To get all the power of the dark cloud cover pattern, first need to understand the intense battle between buyers and sellers that created its unique form. Let’s break down the trading sequence:
Day 1: Bullish Confidence
On this day, the uptrend is mature and strong, which means buyers are confident and pushing the price up significantly. That creates a long green candle; many traders believe that the rally will continue indefinitely.
Day 2: The Illusory Breakout and Bearish Takeover
Optimistic Open: The second day starts with a gap up, like opening higher than the previous day’s close. It makes bullish excitement, so the traders who bought yesterday are happy and new buyers might jump in.
Sudden Reversal: Immediately after the open, a massive wave of selling pressure hits the market.
Bearish Dominance: The selling pressure is strong that it not only negates the initial gap up but drives the price deep into the territory of the previous day’s bullish candle. By closing below, the midpoint of the first candle, the sellers send a clear message: the buyers’ strength has been overcome, and the upward momentum is broken.
This sequence tells us that despite an initial show of strength, the buyers were unable to sustain it. Sellers seized the opportunity, overwhelming the bulls and effectively “covering” their previous gains. This is a strong signal of buyer exhaustion and seller aggression, hinting that the trend might be about to reverse downward.

Where to Spot a High-Probability Dark Cloud Cover Pattern?
A dark cloud cover candle pattern is most effective when it appears in the right context. But still have confusion of finding it, here’s what to look for:
| At the Top of an Uptrend | For the pattern to be valid, it must occur after a sustained period of rising prices. If a Dark Cloud Cover appears in a sideways market, its reversal signal is much weaker. |
| Near Key Resistance Levels | When the pattern forms precisely at a major resistance level, its power is amplified. This shows that sellers are stepping in exactly where the market is expected to find a ceiling. |
| With High Volume | A significant increase in trading volume on the second bearish candle adds tremendous confirmation. High volume during this reversal indicates that a large number of participants are involved in rejecting higher prices, making the bearish reversal more credible. |
| Penetration Depth | The deeper the second bearish candle penetrates the body of the first bullish candle, the stronger the bearish signal. A close below the midpoint is essential; a close near the open of the first candle is even more bearish. |
How to Execute Your Dark Cloud Cover Entry?
Finding the dark cloud cover pattern is just the beginning; the real skill lies in planning your trade.
Entry Point
Some traders enter a short position immediately on the next candle to open after the Dark Cloud Cover has closed, anticipating a rapid downward move. The safe approach is to wait for the next candle (confirmation candle); that provides additional confirmation that the bearish reversal is taking hold.
Stop-Loss Placement
Place your stop-loss order above the high of the second handle in the pattern. It represents the ultimate resistance level that sellers defended. If the price breaks above this level, the bearish reversal has failed, and you should exit the trade to minimize losses.
Conclusion
The dark cloud cover pattern is a visually clear signal of a potential market down. This two-candle structure illustrates the shift from bullish confidence to bearish dominance. It provides traders with an early warning that an uptrend may be coming to an end.
Proper understanding what is dark cloud cover pattern, recognizing its formation at the top of an uptrend, and combining it with other confirmation signals, will enhance your ability to spot potential bearish reversals. Remember, like any trading tool, it requires practice, patience, and strict risk management.
Do You Find This Interesting?
We’d Love to Hear from you-

Frequently Asked Questions
What is the dark cloud cover pattern?
The Dark Cloud Cover is a two-day bearish reversal candlestick pattern. It occurs when a large bullish (green) candle is followed by a large bearish (red) candle that opens above the previous day’s high but closes well within the body of the first candle. It visually represents a “cloud” of selling pressure hanging over the previous day’s gains.
What is the dark cloud cover rule?
To be considered a valid Dark Cloud Cover, the pattern must follow these specific technical rules:
🔹 The Trend: It must appear after a sustained uptrend.
🔹 The Gap: The second (bearish) candle must open above the high of the first (bullish) candle.
🔹 The Penetration: The second candle must close below the 50% midpoint of the first candle’s body. If it does not cross the halfway mark, the signal is considered too weak to be a reversal.
Is dark cloud cover bullish?
No, the Dark Cloud Cover is a bearish reversal pattern. It indicates that the buyers have exhausted their strength and that sellers are aggressively taking control of their shares.
How to use dark cloud cover in trading?
Professional traders use the pattern to identify exit points for long positions or entry points for short positions.
➔ The Setup: Identify the pattern at a major resistance level.
➔ The Confirmation: Wait for the third candle to break below the low of the second candle.
➔ Stop-Loss: Place a stop-loss just above the high of the second (red) candle.
Should I use dark cloud cover every time?
No. Like all technical indicators, it should not be used in isolation. You should only act on a Dark Cloud Cover if:
▶ It aligns with other indicators, such as a bearish divergence on the RSI or a rejection from a Moving Average.
▶ The market is not in a high-volatility sideways range where “choppy” price action can create false signals.
▶ You have confirmed the signal with the subsequent candle price action.
DISCLAIMER: Investment in securities market are subject to market risks, read all the related documents carefully before investing. The securities quoted are exemplary and are not recommendatory. Full disclaimer: https://bit.ly/naviadisclaimer.