Understanding the Cup and Handle Pattern in Technical Analysis

The Cup and Handle Pattern is a popular bullish continuation pattern in technical analysis, signaling a period of consolidation followed by a potential breakout. Named for its resemblance to a tea cup with a handle, this pattern is known for its reliability in forecasting the continuation of an upward trend after a temporary consolidation phase.
In this article, we will explore the key characteristics of the Cup and Handle Pattern, explain how to identify it, and discuss target prices, stop-loss strategies, and how to trade it effectively with examples.
What is the Cup and Handle Pattern?
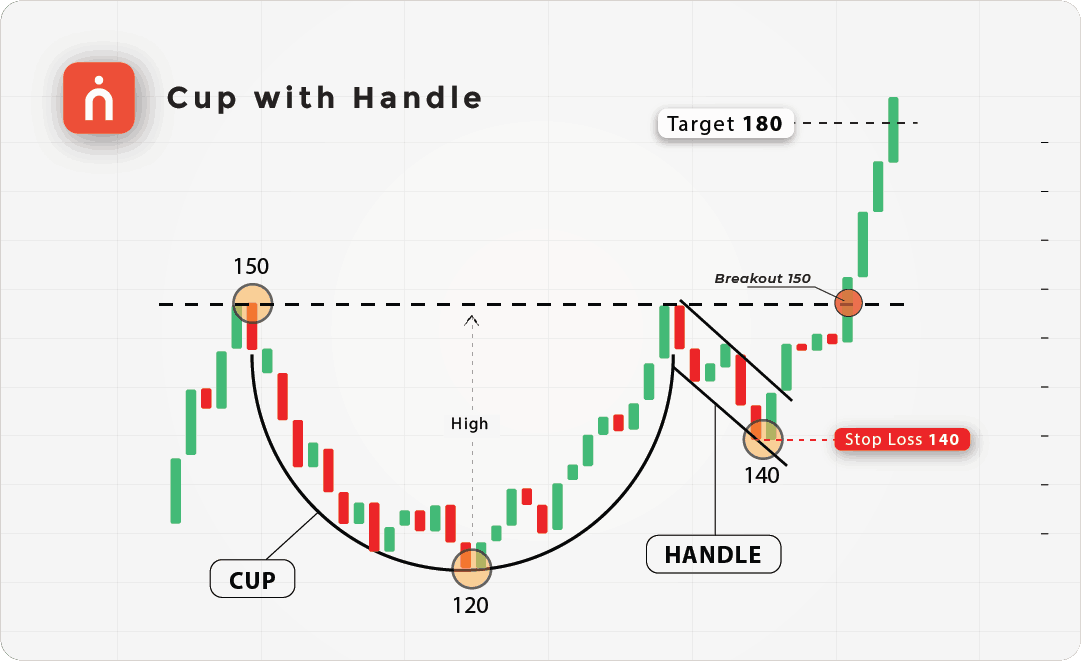
The Cup and Handle Pattern typically occurs in bullish markets and forms after a strong upward price movement. It represents a period of consolidation that is followed by a resumption of the previous trend. The pattern has two distinct parts:
1) The Cup:
The price moves down in a rounded fashion, then rises back to the previous high, forming a “U” shape. This resembles the shape of a tea cup, where the bottom of the cup is rounded, not V-shaped, signaling that the market is stabilizing after a decline.
2) The Handle:
After the price returns to the previous high (the top of the cup), it experiences a brief consolidation or pullback, forming a small downward-sloping channel or triangle. This is the “handle” of the pattern.
The breakout occurs when the price moves above the resistance level formed at the top of the cup and handle, signaling the continuation of the upward trend.
Key Characteristics of the Cup and Handle Pattern
🔸 Rounded Bottom (Cup):
The cup forms a rounded “U” shape, indicating that the market is gradually finding support after a pullback. The rounded shape is important because it suggests that the sell-off has subsided, and buyers are slowly stepping back in.
🔸 Consolidation (Handle):
The handle forms a smaller downward-sloping consolidation after the cup is complete. This phase typically shows low volume and indicates a pause before the breakout.
🔸 Breakout:
The pattern is confirmed when the price breaks above the resistance level formed at the top of the cup and handle. This breakout is usually accompanied by a spike in volume, indicating strong buying interest.
🔸 Volume:
Volume tends to decrease during the formation of the handle and increase significantly at the breakout, confirming the strength of the move.
How to Identify the Cup and Handle Pattern
🠖 Look for a Strong Uptrend:
The pattern forms after a bullish trend. It starts with a strong upward price movement, followed by the formation of the cup.
🠖 Spot the Rounded Cup:
Identify a rounded bottom where the price gradually declines, finds support, and then returns to the previous high, forming a “U” shape.
🠖 Find the Handle:
After the cup, the price experiences a brief consolidation, usually forming a small downward-sloping handle. The handle should not be too deep, typically retracing less than 50% of the cup’s height.
🠖 Wait for the Breakout:
The pattern is confirmed when the price breaks above the resistance level formed at the top of the cup and handle. This breakout is usually accompanied by a surge in volume.
Trading the Cup and Handle Pattern
Entry Point
Enter a long position when the price breaks above the resistance level (top of the cup) with strong volume.
Stop-Loss
Place your stop-loss just below the low of the handle or slightly below the breakout point to protect against false breakouts.
Target Price
The target price is calculated by measuring the height of the cup (distance from the bottom of the cup to the top) and adding that distance to the breakout point.
Numerical Example of a Cup and Handle Pattern
Let’s break down a simple example of a Cup and Handle Pattern using numbers.
| Action | Price (₹) | Description |
|---|---|---|
| Initial Uptrend | 150 | The price moves up from ₹100 to ₹150 before forming the cup |
| Cup Bottom | 120 | Price declines to ₹120, forming the rounded bottom of the cup |
| Return to Resistance | 150 | Price rises back to ₹150, completing the cup |
| Handle Formation | 140 | Price consolidates and forms the handle, pulling back to ₹140 |
| Breakout | 150+ | Price breaks above ₹150, signaling the continuation of the trend |
| Target Price | 180 | Target = ₹150 + (₹150 – ₹120) = ₹180 |
| Stop-Loss | 140 | Stop-loss placed just below the low of the handle at ₹140 |
In this example, the price forms a rounded cup by moving from ₹150 down to ₹120 and then back up to ₹150. After this, the handle forms with a small pullback to ₹140. The breakout above ₹150 signals a continuation of the trend, with a target of ₹180 (the height of the cup added to the breakout point). The stop-loss is placed just below the handle’s low at ₹140.
Significance of the Cup and Handle Pattern
1. Bullish Continuation:
The Cup and Handle Pattern is a bullish continuation pattern, meaning that it indicates a likely continuation of the uptrend after a period of consolidation.
2. Reliable Pattern:
The cup and handle pattern is considered a reliable pattern, especially when it forms over a longer time frame, such as weeks or months, as it represents a healthy consolidation in a bullish market.
3. Volume Confirmation:
A key aspect of the pattern is the increase in volume during the breakout. This volume spike confirms that the breakout is genuine and supported by strong buying interest.
When Does the Cup and Handle Pattern Occur?
The Cup and Handle Pattern usually forms in bullish markets after a strong upward trend. It reflects a healthy consolidation as traders take profits and the market undergoes a correction before resuming the uptrend. The pattern is most likely to form in longer time frames, such as daily, weekly, or monthly charts.
Trading Strategies for the Cup and Handle Pattern 1.
1. In Bullish Markets:
The pattern typically forms during an uptrend, and traders can look for buying opportunities when the price breaks above the resistance level at the top of the cup and handle.
2. Volume-Based Confirmation:
Traders should wait for a volume spike at the breakout point to confirm the validity of the breakout. If the breakout occurs on low volume, it might be a false breakout.
3. Target Price Calculation:
By measuring the height of the cup, traders can set realistic target prices based on the size of the prior price movement.
Example of a Cup and Handle Pattern with Volume Spike
Here’s a detailed example:
| Action | Price (₹) | Volume | Description |
|---|---|---|---|
| Initial Uptrend | 200 | 1,20,000 | Price moves from ₹200 to ₹250 with high volume |
| Cup Bottom | 220 | 80,000 | Price declines to ₹220, forming the rounded bottom |
| Return to Resistance | 250 | 90,000 | Price rises back to ₹250, completing the cup |
| Handle Formation | 240 | 60,000 | Price consolidates, forming the handle |
| Breakout | 250+ | 1,50,000 | Price breaks above ₹250 with a volume spike |
| Target Price | 280 | Target = ₹250 + (₹250 – ₹220) = ₹280 | |
| Stop-Loss | 240 | Stop-loss placed below ₹240 |
In this case, the price forms a rounded cup with declining volume during the formation of the handle. When the price breaks out above ₹250, the volume spikes to 1,50,000 shares, confirming the breakout, and traders can set a target of ₹280 based on the height of the cup.

Conclusion
The Cup and Handle Pattern is a powerful and reliable bullish continuation pattern that can help traders identify buying opportunities during a period of market consolidation. By recognizing the rounded shape of the cup, spotting the handle’s formation, and waiting for a volume-confirmed breakout, traders can effectively trade this pattern and capture potential gains.
With clearly defined entry points, stop-losses, and target prices, the Cup and Handle Pattern offers traders a structured way to participate in bullish market trends while managing risk effectively.
Do You Find This Interesting?
DISCLAIMER: Investments in the securities market are subject to market risks, read all the related documents carefully before investing. The securities quoted are exemplary and are not recommendatory. Brokerage will not exceed the SEBI prescribed limit.


