Riding the Trend: Master the Bearish Mat Hold Pattern and Its Bullish Twin
- What is the Mat Hold Candlestick Pattern?
- Anatomy of the Bullish Mat Hold Candlestick Pattern
- The Dark Side: The Bearish Mat Hold Pattern Explained
- Strategies for Trading the Bearish Mat Hold Pattern
- Common Mistakes to Avoid
- The Bottom Line
- Frequently Asked Questions
In the world of trading, many investors make the mistake of looking only for “reversal” signals-those dramatic moments when a trend flips. However, seasoned professional traders know that real money is often made by identifying continuation patterns. These signals tell you that the market is just taking a breather before resuming its original direction.
One of the most reliable, yet frequently overlooked, continuation signals is the mat hold candlestick pattern. Whether you are navigating a red-hot rally or a steep sell-off, understanding the mechanics of the bearish mat hold pattern and its bullish counterpart can give you the confidence to stay in a trade when others are prematurely jumping ship.
In this comprehensive guide, we will break down the structure, psychology, and trading strategies for these patterns in detail.
What is the Mat Hold Candlestick Pattern?
The mat hold candlestick pattern is a five-candle continuation formation. Unlike a reversal pattern (like a Hammer or Shooting Star) that suggests a change in direction, the Mat Hold confirms that the prevailing trend is strong enough to overcome a brief period of counter-trend movement.
Visually, it looks like a “step” in a staircase. It consists of one large trending candle, followed by three small corrective candles, and finalized by a fifth candle that resumes the initial trend.
While it is very similar to the “Rising Three Methods” or “Falling Three Methods,” the Mat Hold is considered more robust because the three corrective candles do not necessarily have to stay within the range of the first candle body. This “gap” or slight overlap gives it its unique “Mat Hold” name.
Anatomy of the Bullish Mat Hold Candlestick Pattern
Before we dive into the bearish side, it is crucial to understand the more common bullish mat hold candlestick pattern. This pattern appears during an uptrend and signals that buyers are still in control despite a minor dip in price.
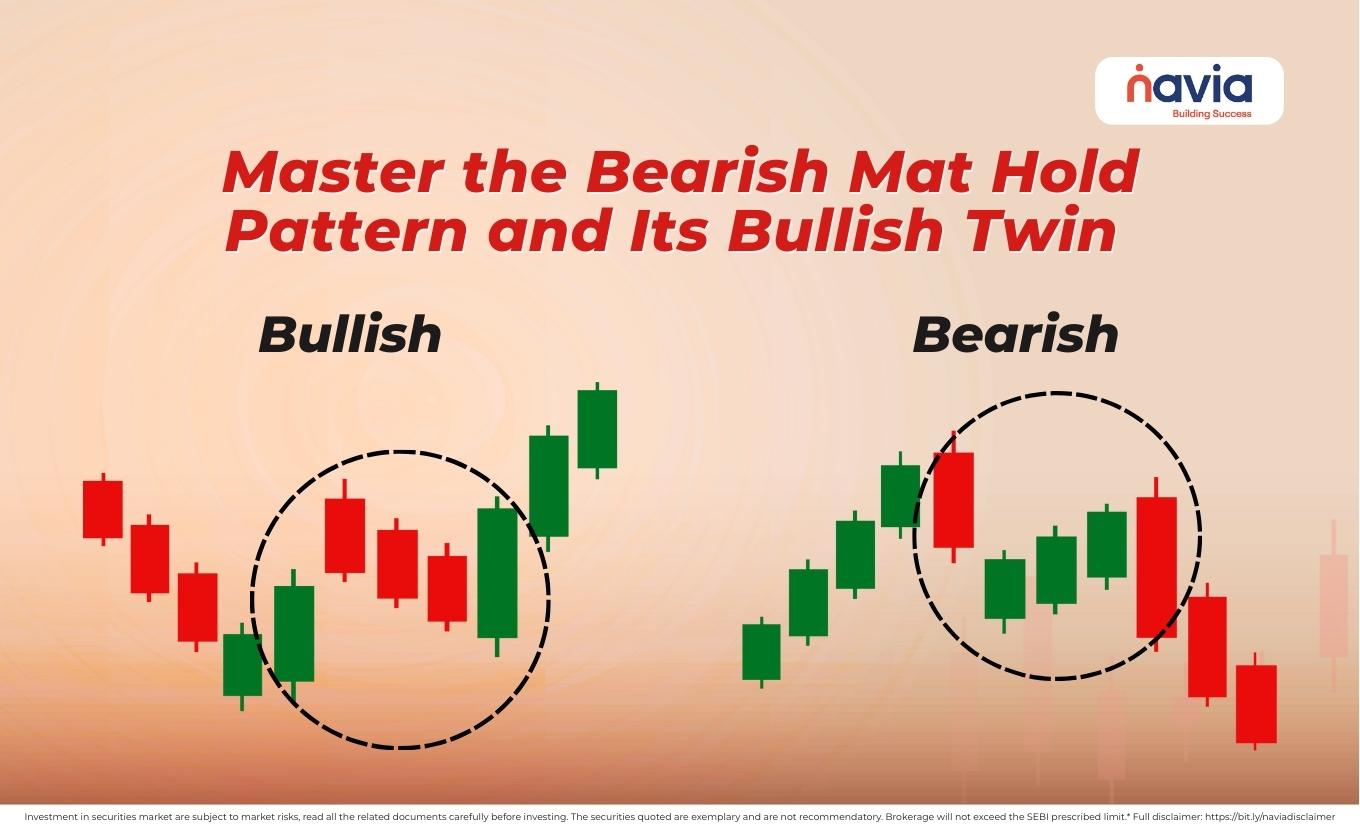
The five-step structure of a Bullish Mat Hold:
| Day 1 | A large bullish (green) candle that reinforces the existing uptrend. |
| Day 2 | A small candle that gaps up but closes slightly lower (bearish). |
| Day 3 & 4 | Two more small-bodied candles that continue to move slightly downward. These represent a “cooling off” period or profit-taking. |
| Day 5 | A large bullish (green) candle that opens above the close of Day 4 and closes at a new high, surpassing the high of the first candle. |
The beauty of the bullish mat hold candlestick pattern is that it shows the bears tried to push the price down for three consecutive days but failed to make any significant progress. When Day 5 breaks the resistance of Day 1, it triggers a massive buy signal.

The Dark Side: The Bearish Mat Hold Pattern Explained
In a falling market, logic flips. The bearish mat hold pattern is a lethal signal for short sellers. It appears during a downtrend and warns traders that the recent “bounce” in price is nothing more than a temporary correction before the next leg down.
If you see a bearish mat hold pattern forming, it is often a sign to add to your short positions or at least stay away from “buying the dip.”
The structure of the Bearish Mat Hold:
| The Lead-In | A long bearish (red) candle appears, showing strong selling pressure. |
| The Correction | Three small candles (usually green) follow. These candles “drift” upward. Crucially, they should not break above the opening price of the first large red candle. |
| The Resumption | The fifth candle is a large red candle that plunges down, closing below the low of the first candle. |
The psychology here is clear: after a big drop, some buyers think the stock is “cheap” and try to push it up. However, their buying is weak (shown by the small candle bodies). On the fifth day, the heavy sellers return, crushing the weak buyers and sending the price to new lows.
Strategies for Trading the Bearish Mat Hold Pattern
Trading the bearish mat hold pattern requires patience. Here is a step-by-step protocol for 2026’s volatile markets (educational purpose only):
| Confirm the Trend | Never trade a Mat Hold in a sideways or choppy market. For a bearish mat hold pattern, ensure the stock is already trading below its 50-day or 200-day Moving Average. |
| The Entry Point | For the bearish version, your entry should be a “Short” sell order placed immediately after the fifth candle closes below the low of the first candle. |
| Stop-Loss Placement | The most logical place for a stop-loss is just above the high of the three small corrective candles. If the price breaks above that level, the “continuation” has failed, and the market might be entering a reversal instead. |
| Volume Analysis | Check the volume on Day 1 and Day 5. In a valid bearish mat hold pattern, volume should be high on the red candles (selling) and significantly lower during the three-day correction (weak buying). |
Common Mistakes to Avoid
🔹 Ignoring the Fifth Candle: The most common mistake is entering the trade on Day 3 or Day 4, assuming the pattern will be complete. You must wait for the fifth candle to close to confirm the trend resumption.
🔹 Misidentifying Reversals: If the three small candles move too high and close above the opening of the first candle, the bearish mat hold pattern is invalidated. At that point, it may be a “Morning Star” or another bullish reversal.
🔹 Trading in Low Liquidity: Small-cap stocks with low volume can create “fake” mat holds. Stick to liquid stocks or indices for better accuracy.
The Bottom Line
The mat hold candlestick pattern is a gift to trend followers. It provides a clear visual map of market exhaustion followed by a surge in strength. By mastering both the bullish mat hold candlestick pattern and the bearish mat hold pattern, you remove the guesswork from your trading.
Instead of panicking when a stock goes against your position for a few days, you can look at the “Mat” and realize the trend is simply holding its ground. As always, combine these patterns with indicators like the RSI or MACD to ensure the highest probability of success.
Do You Find This Interesting?
We’d Love to Hear from you-

Frequently Asked Questions
What exactly does a bearish mat hold pattern indicate?
A bearish mat hold pattern is a five-candle continuation signal that appears during a downtrend. It indicates that despite a brief three-day attempt by buyers to push the price higher (a “pullback” or “consolidation”), the selling pressure remains dominant. The final large red candle confirms that the “bears” have regained control, and the price is likely to continue falling.
How is a bearish mat hold different from the “Falling Three Methods”?
While both are 5-candle bearish continuation patterns, the mat hold pattern is more flexible. In a “Falling Three Methods” pattern, the three small corrective candles must stay strictly within the high and low range of the first candle. In a bearish mat hold, the small candles are allowed to “gap” or move slightly outside that range, making it a more common and robust signal in highly volatile 2026 markets.
Is the mat hold candlestick pattern reliable for intraday trading?
Yes, the mat hold candlestick pattern is effective on shorter timeframes like the 15-minute or 1-hour charts. However, because it requires five consecutive candles to form, it is most reliable on daily or weekly charts where the “noise” of the market is reduced. For intraday use, always confirm the pattern with a volume spike on the fifth candle.
Can a mat hold pattern fail?
Like all technical indicators, the mat hold pattern is not 100% foolproof. A “failed” mat hold occurs when the fifth candle fails to close below the low of the first candle, or if the price immediately reverses after the fifth candle. To avoid “fakeouts,” traders often use supplementary tools like the Relative Strength Index (RSI) to ensure the market isn’t already oversold before entering a short position.
DISCLAIMER: Investment in securities market are subject to market risks, read all the related documents carefully before investing. The securities quoted are exemplary and are not recommendatory. Full disclaimer: https://bit.ly/naviadisclaimer.