How to Spot Sector Rotation in the Stock Market?
- What is Sector Rotation in the Stock Market?
- Why Do Sectors Take Turns Leading the Market?
- How Do You Spot Sector Rotation Using Sectoral Indices?
- Sector Rotation in Action: May to July 2026 (A live example)
- What Actually Happened?
- Which Signals Confirm a Real Sector Rotation?
- What Mistakes Do Beginners Make with Sector Rotation?
- Conclusion
- FREQUENTLY ASKED QUESTIONS
Sector rotation happens when money moves from one group of industries to another. To identify sector rotation in the stock market, track sectoral indices instead of individual stocks. Then compare each sector’s performance with the Nifty 50 over one, three, and six months. Sectors outperforming the index may be attracting greater investor interest, while underperforming sectors may be seeing relatively lower participation. Finally, review trading volumes, market breadth, and broader economic trends for additional context. Sector rotation typically develops over weeks or months, so a single trading session may not indicate a sustained trend.
💡 Quick Answer
Spot sector rotation by tracking NSE sectoral indices rather than individual stocks, then comparing each index with the Nifty 50 over one, three and six months. A sector leading across all three time frames, on rising volumes and broad participation, signals a genuine rotation rather than a short-term bounce.
What is Sector Rotation in the Stock Market?
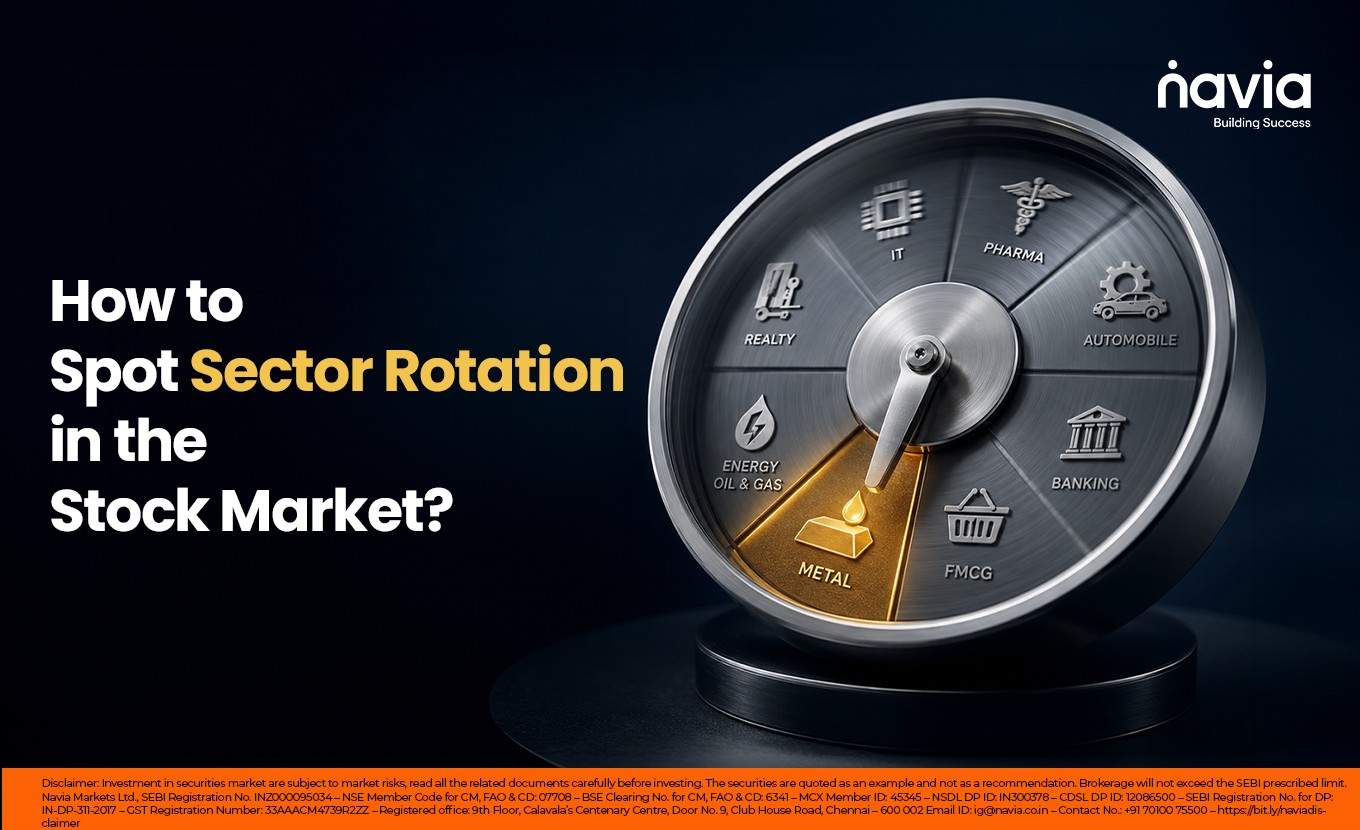
Sector rotation is the movement of money from one market sector to another as economic conditions change, reflecting shifting investor preferences across industries — banking may lead in one phase while IT or metals lead in the next. For the concept from first principles, including the four-phase cycle and what rotation does to a portfolio, see What is Sector Rotation? And How It Impacts Your Portfolio.
Why Do Sectors Take Turns Leading the Market?
Sectors take turns leading because they respond differently to the same conditions: cyclicals such as automobiles, metals and realty move with the economy, while defensives such as FMCG, pharmaceuticals and utilities tend to hold up better when growth slows. Sector Rotation in the Market: Explained Simply for Beginners maps which sectors typically lead in each phase of the cycle.

How Do You Spot Sector Rotation Using Sectoral Indices?
A simple way to identify sector rotation is by tracking sectoral indices, which represent the performance of different sectors of the market. The NSE publishes sectoral indices for sectors such as banking, IT, FMCG, pharmaceuticals, metals, and realty.
Next, compare the performance of a sectoral index with the Nifty 50 over the same time period. If a sector outperforms the Nifty 50, it may indicate relatively stronger performance during that period. Comparing sector performance across different time frames can provide additional context.
The following example uses placeholder sectors for illustration.
| Sector (illustrative) | 3-month return | Nifty 50 return | Relative strength |
|---|---|---|---|
| Sector A | +14% | +6% | +8% (leading) |
| Sector B | +7% | +6% | +1% (in line) |
| Sector C | −2% | +6% | −8% (lagging) |
Figures above are illustrative only. They are not real market returns
Do this for one, three and six months. When a weak sector turns positive in all three, sector rotation may be starting.
None of this requires paid tools. Sectoral index levels are published by the exchange and freely available.
- Rank all sectors monthly, before reading any news. Pull the 1-month and 3-month returns for every sectoral index into one list and sort it. Doing this first stops headlines from deciding what you think led.
- Compare against the benchmark, not against zero. Nifty FMCG rose 0.93% in July — green, but the Nifty 50 returned 2.36%, so it lagged.
- Read across months, not down one. A single strong month can be a bounce off an oversold level. Realty’s June gain only means something once you see that it followed a fall in May and preceded a further gain in July.
- Find the driver. If you can name why — the RBI on hold, crude at $69, an earnings beat, foreign flows turning — the move is something you can reason about. If you cannot, treat it as noise.
- Check whether the sector moved together. An index carried by one or two heavyweight constituents is a narrower and more fragile move than one where most of the sector participated.
- Keep a monthly note. Rotation is only visible if you have a record. Three lines a month builds the pattern recognition faster than any article can.
Sector Rotation in Action: May to July 2026 (A live example)
Sector rotation is easier to understand when you can see it happen. The three months from May to July 2026 offer an unusually clear example, because the sector that was the market’s worst performer in one month became its best in the next.
| Month | Nifty 50 | Sectors that outperformed | Sectors that lagged |
|---|---|---|---|
| May 2026 | ~−2% | Media (~+5%), Nifty Bank (~+3%), PSU Bank (~+3%), Pharma (~+2%). Also ahead of the falling index: Financial Services (~+0.1%), IT (~−0.3%), Auto (~−0.4%) | Commodities (~−5%), Metals (~−4%), FMCG (~−4%), Energy (~−3%), Realty (~−3%), Infrastructure (~−2%) |
| June 2026 | ~+1.4% | Realty (~+11%), Banking (~+8%), Financial Services (~+8%), PSU Banks (~+7%), Pharma (~+5%) | IT (worst — fell sharply), Metals (~−9%), Commodities (~−4%), Energy (~−1%) |
| July 2026 | +2.36% | IT (best, ~+17%), Consumer Durables (~+10%), Media (~+9%), Auto (~+9%), Realty (~+9%) | Energy (~−3%), PSU Bank (~−1.5%), Bank (~−0.5%), FMCG (+0.9%, below index), Metals (+1.8%, below index) |
NSE sectoral index returns, rounded. Figures cross-checked across independent market reviews for the respective months; sources differ slightly on exact decimals. Past performance is not indicative of future results.
Read across the rows and the rotation is obvious:
- IT — roughly flat in May and marginally ahead of a falling index, then the worst sector in June, then the best sector in July. A complete reversal in a single month.
- Banking — led in May, led again in June, then turned negative in July. Two months of leadership, then handover.
- Realty — among the weakest in May, the biggest gainer in June, still strong in July.
- Metals and Commodities — negative in both May and June, recovering only to below-index returns in July.
Two points on how to read the table. In July, FMCG and Metals both rose but returned less than the Nifty 50’s 2.36%, so both lagged — a sector can lag without falling. In May the reverse applied: with the index down around 2%, sectors such as IT and Auto were slightly negative yet still ahead of the market. Rotation is measured against the benchmark, not against zero.
What Actually Happened?
Each shift had a visible cause at the time. That is the part worth paying attention to, because it makes rotation traceable rather than random.
- May — money went defensive. Foreign investors sold heavily, crude stayed elevated and the rupee touched a record low near ₹95.40. The index itself fell around 2%. Investors moved toward defensives and financials and away from anything commodity-linked or rate-sensitive. Realty fell around 3%; metals and commodities took the worst of it.
- June — the rate-sensitives turned. The RBI held the repo rate at 5.25% and Brent crude corrected sharply to around $69. That combination flipped exactly the sectors May had punished: Realty went from roughly −3% to the month’s biggest gainer at around +11%. Banking extended its run on credit growth of 17.7% year-on-year. IT fell hard on a cautious Accenture outlook and weak global technology spending.
- July — IT reversed on earnings. Q1 FY27 results from the large software companies came in well ahead of expectations, foreign portfolio investors turned net buyers for the first time since February with ₹15,412 crore of inflows, and the US Federal Reserve held rates on 29 July. IT went from worst to best. Banking, after leading for two straight months, paused and closed negative.
The pattern across all three months is that the trigger for each rotation was identifiable — a policy decision, a move in crude, an earnings season, a change in foreign flows. None of them was a random shift in sentiment.
Which Signals Confirm a Real Sector Rotation?
A short-term move alone may not indicate sector rotation. Instead, consider multiple factors over different time periods before identifying a sustained trend.
- The sectoral index outperforms the Nifty 50 over one, three, and six months.
- Trading volumes increase alongside the sector’s price movement.
- A broad range of stocks within the sector participate in the move.
- There is a supporting market or economic development, such as changes in interest rates, government policy, or commodity prices.
- Institutional investment activity, including FII and DII data, provides additional context, as does open interest analysis.
- The previously stronger sector shows signs of relatively weaker performance over the same period.
Reviewing these indicators together can provide a more comprehensive view of sector rotation, as no single indicator can confirm a trend on its own.
What Mistakes Do Beginners Make with Sector Rotation?
A common mistake is focusing only on the recent top-performing sector without considering the broader market context. Another is concentrating investments in a single sector, which can increase portfolio risk.
Using very short time frames may also lead to misleading conclusions, as sector rotation often develops over longer periods. In addition, frequent portfolio changes can result in higher transaction costs and taxes, which may affect overall investment outcomes.
Conclusion
You can identify sector rotation by tracking sectoral indices, comparing their performance with the Nifty 50, and reviewing supporting factors such as trading volumes, market breadth, and broader economic developments. Together, these indicators can help you better understand changing market trends.
Sector rotation should be used as one of several tools for market analysis rather than as a standalone basis for investment decisions. The Navia All in One App provides access to market data and tools that can help you follow these trends.
Key Takeaways
- Sector rotation is tracked through sectoral indices, not individual stocks — the NSE publishes them for banking, IT, FMCG, pharmaceuticals, metals and realty.
- Performance is measured against the Nifty 50, not against zero — a sector can rise and still lag, or fall and still lead.
- Confirmation needs outperformance over one, three and six months, rising volumes, broad participation within the sector, and an identifiable driver.
- May to July 2026 showed three clean handovers — defensives, then rate-sensitives, then IT — each with a nameable trigger.
- Ranking every sector monthly before reading the news stops headlines from deciding what you think led.
- Rotation develops over weeks or months, so a single session or a single strong month is not a trend.
Did you find this interesting?
Your feedback is important to us! –

FREQUENTLY ASKED QUESTIONS
How long does a sector rotation last?
The duration of sector rotation can vary depending on market and economic conditions. Some trends may last for several months, while others may change more quickly. Analyzing longer time frames can provide additional context.
Which sectors have done well in the last few years?
Sector leadership in India changes hands frequently rather than staying with any one sector — over the decade to March 2024, Realty and Metal delivered the highest returns among the Nifty sectoral indices, while FMCG and Media were the only two to trail the Nifty 50. More recently, Pharma and Realty led in calendar 2024, 2025 was a far more selective and defensive year, and 2026 has seen unusually rapid rotation, with Nifty IT swinging from the market’s worst-performing sector in June to its best in July. The sectors with the strongest long-run returns have also tended to be the most volatile, and past sectoral performance is not indicative of future returns.
DISCLAIMER: Investment in securities market are subject to market risks, read all the related documents carefully before investing. The securities quoted are exemplary and are not recommendatory. Full disclaimer: https://bit.ly/naviadisclaimer