What is Max Pain in Options Trading?
If you’ve ever looked at an how options trading works and wondered why prices seem to gravitate toward certain strike prices on expiry day — you’re not alone. What you’re witnessing may be the effect of Max Pain.
Let’s break it down in plain English.
What is Max Pain?
Max Pain (also called the Option Pain Point) is the strike price where the combined value of all open call and put options is lowest — i.e., where option sellers (usually institutions) lose the least, and option buyers (retail traders) lose the most.
On expiry day, prices sometimes tend to move closer to this level, though it is not assured.
Why is Max Pain Important?
1. Predictive Tool Near Expiry
Max Pain can help you estimate where the stock/index might settle on expiry.
2. Understand Market Psychology
It tells you where the largest concentration of unwinding or losses might occur — valuable info for traders.
3. Institutional Footprint
Since option sellers are usually large players (and more profitable), following Max Pain can show you where they’re positioned.
How to Calculate Max Pain (Step-by-Step)
You’ll Need:
🔸 An option chain (with strike-wise Open Interest data for both Calls and Puts)
🔸 A simple spreadsheet or calculator
Quick Example
Let’s say NIFTY is at 24,950.
| Strike | Call OI | Put OI | Max Pain Loss (Simplified) |
|---|---|---|---|
| 24,800 | 12L | 14L | ₹55 Cr |
| 24,900 | 10L | 13L | ₹42 Cr |
| 25,000 | 9L | 10L | ₹39 Cr Lowest |
| 25,100 | 7L | 9L | ₹48 Cr |
Here, Max Pain = 25,000, because total pain to buyers is lowest here — meaning sellers are safe, and price might settle near this.
Let’s walk through a detailed example on how to compute the max pain
Imagine a stock is trading around ₹100. Here’s some simplified Open Interest (OI) data for a few strike prices:
| Strike Price | Call OI (Lots) | Put OI (Lots) |
|---|---|---|
| ₹95 | 1,000 | 300 |
| ₹100 | 800 | 800 |
| ₹105 | 600 | 1,000 |
We’ll now compute the total loss to option buyers if the stock expires at each strike.
If Stock Expires at ₹95
Call Buyers:
🠖 ₹95 CALL: In the money → 0 loss (they gain)
🠖 ₹100 CALL: OTM → loses full premium → 800 lots × ₹5 = ₹4,000 loss
🠖 ₹105 CALL: OTM → loses full premium → 600 × ₹10 = ₹6,000 loss
Total CALL Loss = ₹4,000 + ₹6,000 = ₹10,000
Put Buyers:
🠖 ₹95 PUT: ATM → 0 loss (they get full value)
🠖 ₹100 PUT: In the money → 0 loss
🠖 ₹105 PUT: In the money → 0 loss
Total PUT Loss = ₹0
Total Buyer Loss @ ₹95 = ₹10,000
If Stock Expires at ₹100
Call Buyers:
🠖 ₹95 CALL: ITM → no loss
🠖 ₹100 CALL: ATM → 0 loss (break-even)
🠖 ₹105 CALL: OTM → loses full premium → 600 × ₹5 = ₹3,000
Total CALL Loss = ₹3,000
Put Buyers:
🠖 ₹95 PUT: OTM → loses full premium → 300 × ₹5 = ₹1,500
🠖 ₹100 PUT: ATM → 0 loss
🠖 ₹105 PUT: ITM → no loss
Total PUT Loss = ₹1,500
Total Buyer Loss @ ₹100 = ₹4,500
If Stock Expires at ₹105
Call Buyers:
🠖 All are ITM → no loss
Total CALL Loss = ₹0
Put Buyers:
🠖 ₹95 PUT: OTM → full loss → 300 × ₹10 = ₹3,000
🠖 ₹100 PUT: OTM → full loss → 800 × ₹5 = ₹4,000
🠖 ₹105 PUT: ATM → break-even → no loss
Total PUT Loss = ₹7,000
Total Buyer Loss @ ₹105 = ₹7,000
Final Comparison
| Strike Price | Total Buyer Loss |
|---|---|
| ₹95 | ₹10,000 |
| ₹100 | ₹4,500 Lowest |
| ₹105 | ₹7,000 |
The strike with lowest total buyer loss is ₹100 — this would be identified as the Max Pain level in this example scenario.
In Simple Words:
For each possible expiry strike:
● Assume all OTM options expire worthless.
● Multiply OTM OI × premium lost (estimated or actual).
● Sum for all strikes — the strike with lowest total loss = Max Pain

Summary
| Term | Meaning |
|---|---|
| Max Pain | Strike where option buyers lose most & sellers lose least |
| Used For | Expiry day prediction, trading bias |
| Best Used | Near expiry, with price action and OI confirmation |
| Tool Needed | Option Chain + basic calculator (or ready-made tool) |
Tools to Track Max Pain Automatically
You don’t have to calculate it manually every time.
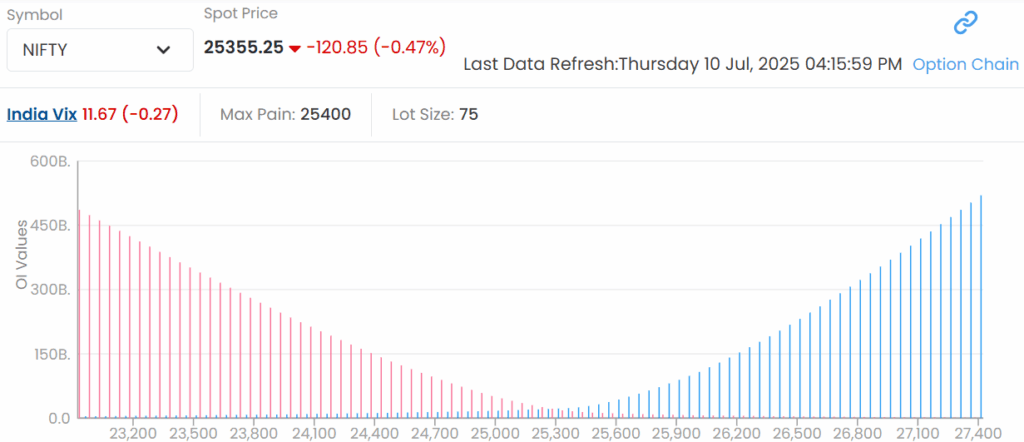
Some platforms, including Navia, offer option chain tools that display Max Pain levels and charts for easier tracking.
Real Example of a Max pain Chart;
Source: niftytrader
Pro Tips
🔸 Max Pain is not a guarantee, just a useful indicator.
🔸 Combine it with OI shifts, volume, and price action for better accuracy.
🔸 Works best when there’s 1–2 days left before expiry.
Final Thoughts
Max Pain gives a glimpse into how the big players (option writers) are positioned and how markets may behave around expiry. While it’s not a magic formula, it’s a smart addition to your trading toolbox — especially when paired with other indicators.
Do You Find This Interesting?
We’d Love to Hear from you-

DISCLAIMER: Investments in securities market are subject to market risks, read all the related documents carefully before investing. The securities quoted are exemplary and are not recommendatory. Full disclaimer: https://bit.ly/naviadisclaimer.