Charting Combined Option Premium: How Pro Traders Time Option Trades Using a Simple Metric
- What Is Combined Option Premium?
- How to Plot It?
- How Pro Traders Use Combined Premium?
- 1. High Premium = High Volatility or Event Risk
- 2. Dropping Premium = Smart Money Exiting
- 3. Sudden Premium Spike Without Price Move = Big Money Positioning
- 4. Expiry Day Trick
- How to Use It Effectively?
- Final Thoughts
- Key Takeaways
While most traders obsess over direction, professional options traders often track something much quieter — the combined premium of ATM Call and Put options.
Why? Because this one value tells them more about volatility, sentiment, and upcoming market moves than price alone.
Let’s break it down — with real Nifty 25,000 examples.
💡 Quick Answer
Combined option premium is simply the ATM Call premium plus the ATM Put premium. If Nifty is at 25,000 and the 25,000 CE trades at ₹110 while the 25,000 PE trades at ₹130, the combined premium is ₹240. That single number reflects the market’s expectation of movement, current implied volatility and the time value left before expiry. Track it every 5, 15 or 30 minutes against Nifty spot: a high reading signals event risk, a steady fall with flat price signals traders exiting, and a spike without a price move often means big money is positioning for a break.
What Is Combined Option Premium?
It’s the sum of the premiums of the ATM (At-the-Money) Call and Put options.
Combined Premium=ATM Call Premium + ATM Put Premium
If Nifty is at 25,000, the ATM strike is 25,000.
Let’s say (illustrative example):
- 25,000 CE is trading at ₹110
- 25,000 PE is trading at ₹130
Combined Premium = ₹240
This combined premium reflects:
- Market’s expectation of movement
- Current implied volatility
- Time value left before expiry
How to Plot It?
- Track ATM CE + PE every 5, 15, or 30 minutes
- Plot it as a line or area chart
- Overlay with Nifty spot price
Platforms like Navia ALL in One Zero f&o Brokerage APP let you track this visually. Live option chain data for the same strikes is also published by the NSE.
How Pro Traders Use Combined Premium?
1. High Premium = High Volatility or Event Risk
If combined premium is unusually high, it signals:
- Upcoming event (RBI, Fed, Budget)
- Uncertainty or sharp move expected
Pro move: Avoid selling options into high premiums unless you expect a volatility crush.
2. Dropping Premium = Smart Money Exiting
If combined premium steadily drops while price is sideways:
- Traders are exiting
- Volatility expectations are declining
This often leads to:
- A sudden breakout once everyone relaxes
- Or a dull range-bound expiry
Cross-checking this against open interest analysis tells you whether the falling premium is genuine unwinding or fresh writing.

3. Sudden Premium Spike Without Price Move = Big Money Positioning
Let’s use a real chart-style example:
| Time | Nifty Spot | 25,000 CE | 25,000 PE | Combined Premium |
| 10:00 AM | 25,000 | ₹110 | ₹130 | ₹240 |
| 11:30 AM | 24,990 | ₹90 | ₹120 | ₹210 |
| 12:00 PM | 24,985 | ₹100 | ₹150 | ₹250 spike! |
Interpretation:
Nifty barely moved, but premium spiked.
Likely cause? Option buyers entering — a breakout or reversal could be coming.
Smart traders watch for this as a timing signal.
Shown below is the combined premium chart of Nifty on 20 June 2025 plotted for the last 5 trading days.
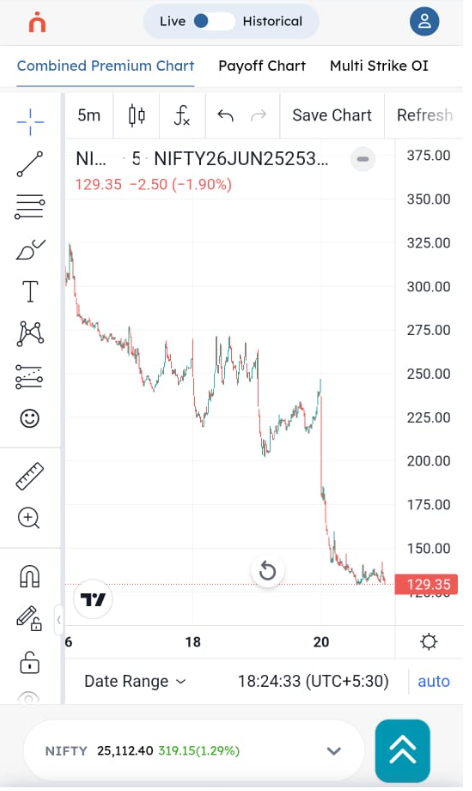
You can analyze the Combined Premium Chart through Navia all-in-one app.
4. Expiry Day Trick
On expiry:
- Premiums collapse due to time decay
- A reversal in combined premium mid-day can sometimes precede a sharp directional move
If the premium rises even briefly, it means traders are bracing for one last spike — and you may catch it early. Reading it next to the max pain level shows whether that late move is fighting or following where the option writers are positioned.
How to Use It Effectively?
| Pattern | What It Means |
| Premium Falling + Flat Price | IV is dropping, breakout may come soon |
| Premium Rising + Flat Price | Anticipation of a move (often reversal) |
| Premium High + Event Ahead | Risk priced in — wait for post-event move |
Because this is an intraday signal, the number of orders adds up quickly, so it pays to know the charges that still apply to every F&O trade before you scale the frequency.
Final Thoughts
Combined Premium is:
- Easy to calculate
- Great for identifying sentiment shifts
- Powerful for intraday & expiry trading
But remember — it’s a signal, not a strategy on its own.
Always use it with price action, volume, and OI data.
Key Takeaways
- Combined option premium is the ATM Call premium plus the ATM Put premium — with Nifty at 25,000, a ₹110 CE and a ₹130 PE give a combined premium of ₹240.
- The number captures three things at once: expected movement, current implied volatility, and the time value left before expiry.
- An unusually high reading points to event risk such as RBI, Fed or Budget, so selling into it only works if you expect a volatility crush.
- A steady fall with flat price means traders are exiting, while a spike with no price move usually means option buyers are positioning for a break.
- Plot it every 5, 15 or 30 minutes against Nifty spot, and treat it as a signal to confirm with price action, volume and OI — never as a standalone strategy.
Do You Find This Interesting?
We’d Love to Hear from you-

DISCLAIMER: Investments in securities market are subject to market risks, read all the related documents carefully before investing. The securities quoted are exemplary and are not recommendatory. Full disclaimer: https://bit.ly/naviadisclaimer