Understanding the Gravestone Doji Chart Pattern: A Guide for Traders

Chart patterns play a crucial role in technical analysis, helping traders identify potential market reversals and continuations. Among these patterns, the Gravestone Doji is one of the most distinctive and telling formations. It is a candlestick pattern that signals a potential reversal in the market, often indicating a bearish trend. In this blog, we will break down the Gravestone Doji pattern, explain the math and psychology behind it, and show you how to effectively use this pattern in your trading strategy. We will also provide examples in a tabular form and discuss how to use the Navia Mobile App for analyzing chart patterns.
What is a Gravestone Doji?
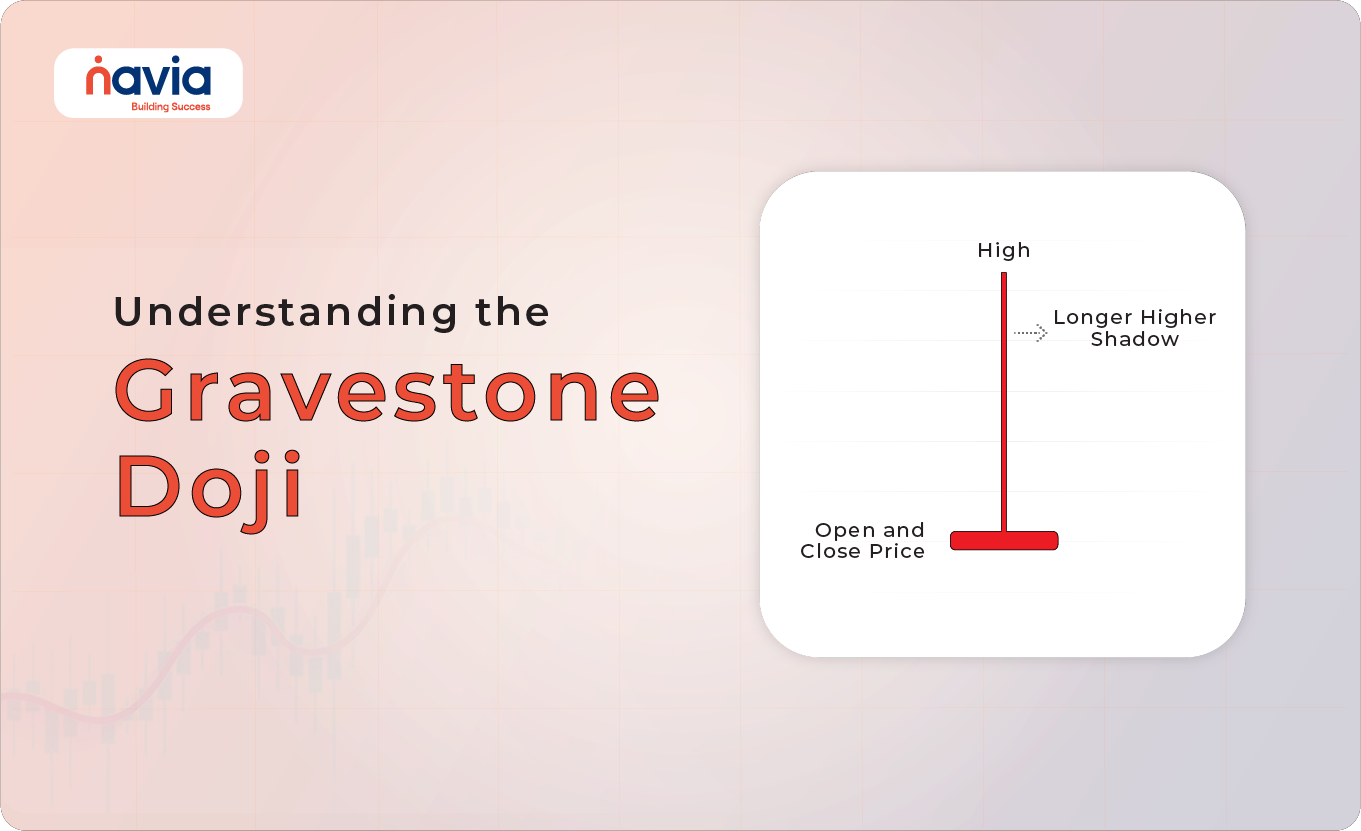
The Gravestone Doji is a type of candlestick pattern that occurs when the opening and closing prices of a security are almost identical, and both are located at the low of the trading session. This pattern is characterized by a long upper shadow and no lower shadow (or a very short one), creating a shape that resembles a gravestone. The Gravestone Doji typically appears at the end of an uptrend and is considered a strong bearish reversal signal.
The Math Behind the Gravestone Doji
Understanding the math behind the Gravestone Doji helps traders appreciate the significance of this pattern. The key components of this pattern are the open, high, low, and close prices:
1) Open Price: The price at which the security opens the trading session.
2) High Price: The highest price reached during the trading session.
3) Low Price: The lowest price reached during the trading session.
4) Close Price: The price at which the security closes the trading session.
In a Gravestone Doji, the open, low, and close prices are nearly the same, while the high price is significantly higher. This price action reflects a battle between buyers and sellers, where buyers initially push the price up, but sellers eventually overpower them, driving the price back down to the open (or close) level. This results in a long upper shadow and little to no lower shadow.
Psychology Behind the Gravestone Doji
The Gravestone Doji represents a dramatic shift in market sentiment. Initially, bulls dominate the session, pushing the price higher. However, the bulls’ strength wanes as the session progresses, and the bears take control, driving the price back down to where it started. This rejection of higher prices is a strong indication that the uptrend may be losing momentum and a reversal could be imminent.
How to Identify a Gravestone Doji
To identify a Gravestone Doji on a chart, look for the following characteristics:
1) Long Upper Shadow: The upper shadow should be long, indicating that the price was pushed significantly higher during the session but failed to hold those gains.
2) No Lower Shadow: There should be no lower shadow, or it should be very small. This indicates that the price did not drop below the open/close level during the session.
3) Open and Close at the Same Level: The open and close prices should be almost identical, ideally at the session’s low.
Example of a Gravestone Doji
Let’s consider a practical example to illustrate the Gravestone Doji pattern:
| Trading Session | Open Price | High Price | Low Price | Close Price | Pattern |
| Previous Day | ₹100 | ₹110 | ₹95 | ₹105 | Bullish Candle |
| Gravestone Doji Day | ₹106 | ₹115 | ₹105 | ₹105 | Gravestone Doji |
| Next Day | ₹104 | ₹107 | ₹95 | ₹96 | Bearish Candle |
Explanation:
➝ On the day of the Gravestone Doji, the price opened at ₹106, climbed to a high of ₹115, but then fell back to close at ₹105, near the session’s low.
➝ The long upper shadow indicates that buyers attempted to push the price higher, but sellers ultimately regained control.
➝ The next day, the price opens lower and continues to decline, confirming the bearish reversal signaled by the Gravestone Doji.
When and How to Use the Gravestone Doji
The Gravestone Doji is most effective when it appears after a sustained uptrend. It signals that the bulls may be losing control, and the market could be preparing for a bearish reversal. Here’s how to use this pattern effectively:
🔶 Confirmation is Key: Always look for confirmation before acting on a Gravestone Doji. This could be in the form of a bearish candlestick on the following day or a break below a key support level.
🔶 Combine with Other Indicators: Use the Gravestone Doji in conjunction with other technical indicators, such as RSI, MACD, or volume analysis, to increase the accuracy of your predictions.
🔶 Place Stop-Loss Orders: If you decide to trade based on a Gravestone Doji, consider placing a stop-loss order above the high of the Doji to protect against false signals.
Practical Trading Strategy Using Gravestone Doji
Here’s a simple trading strategy that incorporates the Gravestone Doji pattern:
1) Identify the Pattern: Look for a Gravestone Doji at the top of an uptrend.
2) Wait for Confirmation: Wait for a bearish candlestick or a significant drop in price on the next trading session.
3) Enter a Short Position: Once confirmation is received, enter a short position.
4) Set a Stop-Loss: Place a stop-loss order just above the high of the Gravestone Doji to limit potential losses.
5) Take Profit: Consider taking profit at a key support level or using a trailing stop to lock in gains as the price moves in your favor.
Example of a Gravestone Doji Trading Strategy
| Step | Action | Price Level |
| Identify Pattern | Gravestone Doji identified at ₹105 | ₹105 |
| Wait for Confirmation | Bearish candle closes at ₹96 | ₹96 |
| Enter Short Position | Sell at ₹95 | ₹95 |
| Set Stop-Loss | Stop-loss at ₹116 (above Doji high) | ₹116 |
| Take Profit | Target key support level at ₹90 | ₹90 |
How to Use Navia Mobile App for Analyzing Chart Patterns
The Navia Mobile App is a powerful tool that can help traders effectively analyze chart patterns, including the Gravestone Doji. Here’s how you can use the app to enhance your trading decisions:
Real-Time Charting Tools: The Navia Mobile App offers real-time charting tools that allow you to easily spot candlestick patterns like the Gravestone Doji. You can customize your charts with various time frames and technical indicators.
Pattern Recognition: Use the app’s pattern recognition features to automatically identify key candlestick patterns, including the Gravestone Doji. This saves time and ensures you don’t miss critical signals.
Backtesting Strategies: The app allows you to backtest your trading strategies based on historical data. You can see how the Gravestone Doji pattern performed in the past and refine your approach accordingly.
Risk Management Tools: Navia’s built-in risk management tools help you set stop-loss and take-profit levels based on your trading strategy, ensuring that you manage your risk effectively.
Summary Table: Gravestone Doji at a Glance
| Feature | Description |
| Shape | Long upper shadow, no lower shadow, open and close prices near the low |
| Signal | Bearish reversal, typically appears after an uptrend |
| Psychology | Indicates that buyers initially drove prices up, but sellers took control, pushing the price back down |
| Best Use | Most effective at the top of an uptrend, signals potential reversal |
| Confirmation Needed | Always wait for a bearish candle or a break below support for confirmation |
| Risk Management | Use stop-loss orders above the Doji high to protect against false signals |

Conclusion
The Gravestone Doji is a powerful candlestick pattern that can provide early warning of a potential market reversal. By understanding the math and psychology behind this pattern, and combining it with other technical indicators and confirmation signals, traders can use the Gravestone Doji to make informed trading decisions. The Navia Mobile App further enhances your ability to analyze and act on chart patterns, providing you with the tools and real-time data necessary for successful trading.
Whether you’re a beginner or an experienced trader, mastering the Gravestone Doji pattern and incorporating it into your trading strategy can help you navigate the markets more effectively and achieve your financial goals. Happy trading!
We’d Love to Hear from you-
DISCLAIMER: Investments in the securities market are subject to market risks, read all the related documents carefully before investing. The securities quoted are exemplary and are not recommendatory. Brokerage will not exceed the SEBI prescribed limit.


