

Understanding the Triple Bottom Pattern in Technical Analysis
The Triple Bottom Pattern is a bullish reversal pattern that signals the potential for a reversal from a downtrend to an uptrend. It is a more extended version of the Double Bottom Pattern, with the price making three distinct lows before breaking out above a key resistance level. The pattern indicates that selling pressure is diminishing, and buyers are increasingly stepping in, potentially leading to an upward price movement.
In this article, we will explain how to identify the Triple Bottom Pattern, discuss its significance, explain target prices and stop-loss strategies, and provide numerical examples to simplify the concept.
What is the Triple Bottom Pattern?
The Triple Bottom Pattern forms after a prolonged downtrend and is characterized by three distinct lows at roughly the same price level. These three bottoms indicate that the price has found strong support at a certain level, as sellers are unable to push the price lower. The pattern is confirmed when the price breaks above the neckline (a resistance level connecting the highs between the three bottoms), signaling a reversal in the trend from bearish to bullish.
Key Characteristics of the Triple Bottom Pattern
1. Three Equal Lows:
The price forms three consecutive lows at roughly the same price level, indicating strong support and a potential reversal.
2. Neckline (Resistance):
The neckline is drawn across the intermediate highs that form between the bottoms. A breakout above this resistance level confirms the pattern and signals a bullish reversal.
3. Volume:
Volume typically decreases as the pattern develops and increases significantly during the breakout above the neckline, confirming the reversal.
4. “W” with Three Lows Shape:
The pattern resembles a “W” shape with an additional low, representing the three bottoms, and a breakout point above the neckline.
How to Identify the Triple Bottom Pattern
🠖 Identify Three Lows:
Look for three consecutive lows at roughly the same price level, signaling strong support. Each low should occur after a decline, and the three bottoms should form over a significant period of time (weeks or months).
🠖 Spot the Neckline:
Draw a neckline by connecting the highs that form between the bottoms. This horizontal or slightly downward-sloping line acts as a resistance level.
🠖 Wait for the Breakout:
The pattern is confirmed when the price breaks above the neckline with strong volume, signaling a bullish reversal.
🠖 Measure the Target:
Measure the distance between the neckline and the lowest point of the pattern and project that distance upward from the neckline to set a target price.
Trading the Triple Bottom Pattern
Entry Point
- Enter a long position when the price breaks above the neckline with significant volume, confirming the reversal.
Stop-Loss
- Place your stop-loss just below the third bottom to protect against a potential false breakout.
Target Price
The target price is calculated by measuring the height of the pattern (the distance between the neckline and the three bottoms) and projecting that distance upward from the breakout point.
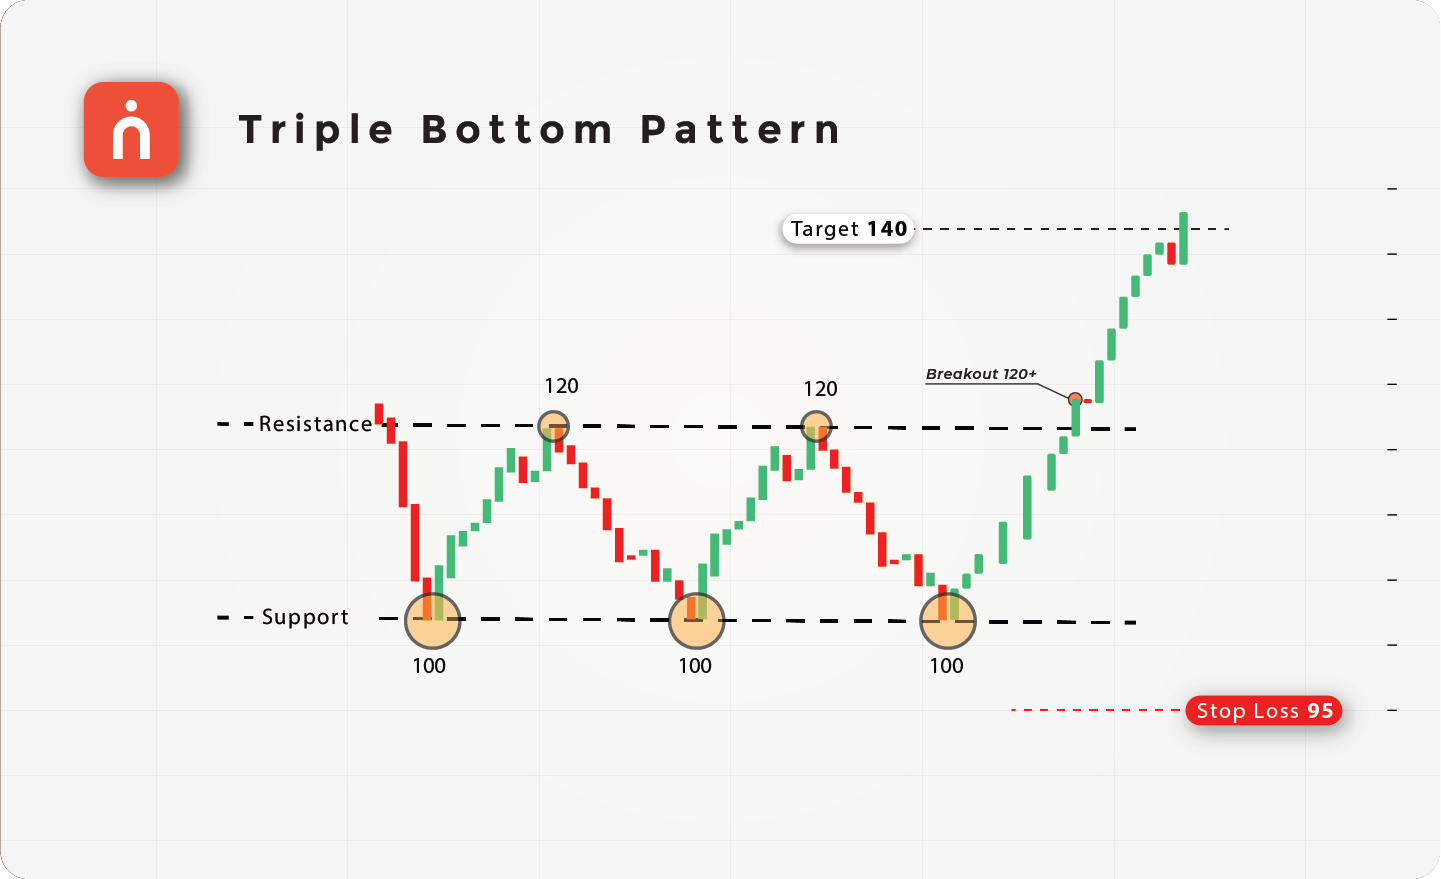
Numerical Example of a Triple Bottom Pattern
Let’s break down a simple example of a Triple Bottom Pattern using numbers.
| Action | Price (₹) | Description |
|---|---|---|
| First Bottom | 100 | Price declines to ₹100, forming the first bottom |
| Intermediate High | 120 | Price rises to ₹120, forming the first intermediate high |
| Second Bottom | 100 | Price declines again to ₹100, forming the second bottom |
| Second High | 120 | Price rises again to ₹120, forming the second intermediate high |
| Third Bottom | 100 | Price declines for the third time to ₹100 |
| Breakout | 120+ | Price breaks above ₹120 with strong volume |
| Target Price | 140 | Target = ₹120 + (₹120 – ₹100) = ₹140 |
| Stop-Loss | 95 | Stop-loss placed just below the third bottom at ₹95 |
In this example, the price forms three consecutive bottoms at ₹100, each time rising to ₹120 in between the bottoms. The neckline is drawn at ₹120, and once the price breaks above this level, the pattern is confirmed. The target price is calculated at ₹140, based on the height of the pattern (₹120 – ₹100 = ₹20) added to the breakout point. The stop-loss is placed just below ₹100 at ₹95.
Significance of Volume in the Triple Bottom Pattern
Volume plays a critical role in confirming the Triple Bottom Pattern:
1. Volume During the Pattern:
Volume generally decreases as the three bottoms form, reflecting weakening selling pressure.
2. Volume Spike at Breakout:
A volume spike during the breakout confirms that the bulls are taking control and validates the reversal. Without this increase in volume, the breakout could be a false signal.
3. Avoiding False Breakouts:
A breakout with low volume may signal a false breakout. Traders should wait for a volume surge to confirm the validity of the pattern.
Example of a Triple Bottom Pattern with Volume Spike
Here’s another example of a Triple Bottom Pattern with volume:
| Action | Price (₹) | Volume | Description |
|---|---|---|---|
| First Bottom | 200 | 1,00,000 | Price declines to ₹200, forming the first bottom |
| Intermediate High | 240 | 80,000 | Price rises to ₹240, forming the neckline resistance |
| Second Bottom | 200 | 70,000 | Price declines again to ₹200, forming the second bottom |
| Second High | 240 | 70,000 | Price rises again to ₹240 |
| Third Bottom | 200 | 65,000 | Price declines for the third time to ₹200 |
| Breakout | 240+ | 1,50,000 | Price breaks above ₹240 with a volume spike |
| Target Price | 280 | Target = ₹240 + (₹240 – ₹200) = ₹280 | |
| Stop-Loss | 195 | Stop-loss placed just below ₹200 |
In this example, the price forms three lows at ₹200, and the neckline is drawn at ₹240. When the price breaks above ₹240, accompanied by a volume spike (from 70,000 shares to 1,50,000 shares), the bullish reversal is confirmed. The target price is set at ₹280, and the stop-loss is placed below ₹200 at ₹195.
When Does the Triple Bottom Pattern Occur?
The Triple Bottom Pattern typically forms after a prolonged downtrend and signals a reversal in market sentiment. It indicates that the selling pressure has exhausted, and buyers are stepping in to drive the price higher. The pattern is most reliable when it forms over a longer time frame (weeks or months) and is confirmed by increasing volume during the breakout.
Trading Strategies for Triple Bottom Patterns
In Bullish Markets:
The Triple Bottom Pattern signals a bullish reversal, and traders can look for buying opportunities when the price breaks above the neckline resistance level.
Volume-Based Confirmation:
A volume spike during the breakout is crucial to confirm the strength of the reversal. Without strong volume, the breakout may be a false signal.
Target and Stop-Loss Setting:
Use the height of the pattern to set a realistic target price, and place your stop-loss just below the third bottom to minimize risk.

Conclusion
The Triple Bottom Pattern is a reliable and easily recognizable bullish reversal pattern that signals a potential reversal in market direction from a downtrend to an uptrend. By identifying the three consecutive lows, drawing the neckline, and waiting for a volume-confirmed breakout, traders can effectively trade this pattern and capitalize on the reversal.
With well-defined entry points, stop-loss levels, and target prices, the Triple Bottom Pattern provides a structured and relatively low-risk strategy for traders looking to profit from bullish market reversals.
Do You Find This Interesting?
We’d Love to Hear from you-

DISCLAIMER: Investments in the securities market are subject to market risks, read all the related documents carefully before investing. The securities quoted are exemplary and are not recommendatory. Brokerage will not exceed the SEBI prescribed limit.


